Unlock a world of possibilities! Login now and discover the exclusive benefits awaiting you.
- Qlik Community
- :
- All Forums
- :
- QlikView App Dev
- :
- How to create a graph table with both text and a s...
- Subscribe to RSS Feed
- Mark Topic as New
- Mark Topic as Read
- Float this Topic for Current User
- Bookmark
- Subscribe
- Mute
- Printer Friendly Page
- Mark as New
- Bookmark
- Subscribe
- Mute
- Subscribe to RSS Feed
- Permalink
- Report Inappropriate Content
How to create a graph table with both text and a small graph nearby?
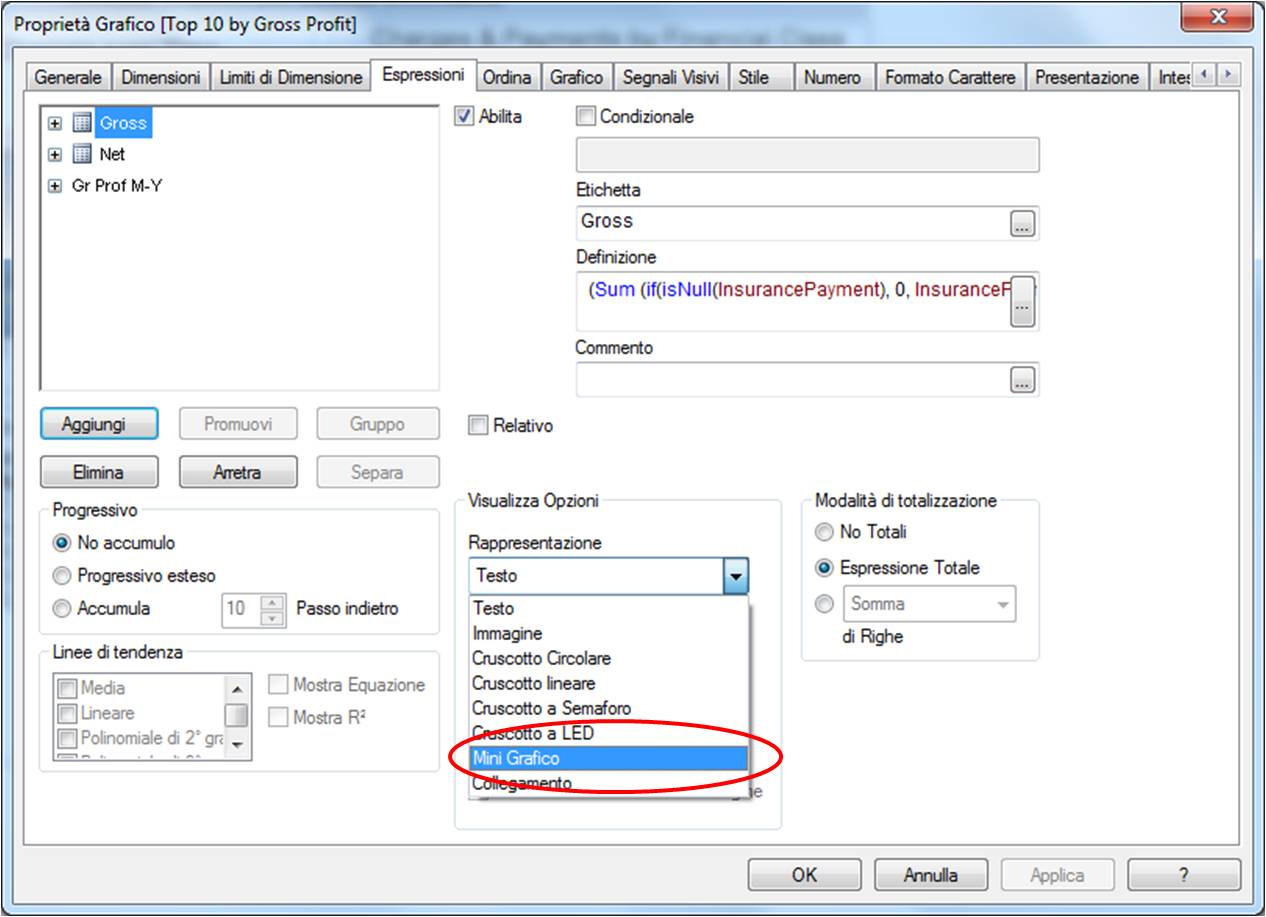
I've tried to reproduce such a table (see attachment 1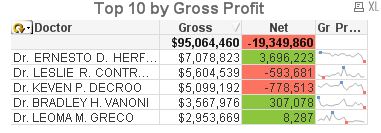 ) but in the properties of the table I cannot see the option INSERT A SMALL GRAPH (as I can see in the demo qlikview file, see screeschot).
I'm using the 11th version, what problem can I have? Thanks for your help
Alessandra
Accepted Solutions
- Mark as New
- Bookmark
- Subscribe
- Mute
- Subscribe to RSS Feed
- Permalink
- Report Inappropriate Content
If you have an expression in a pivot table or straight chart then you can choose minichart as representation and then change the settings for the minichart.
So... are you trying to do this in a pivot chart or straight chart? Other chart types don't allow minicharts
And are you trying to do this for an expression? You can't show a dimension as a minichart.
If this doesn't help, please post the document you're working on (or a small sample)
talk is cheap, supply exceeds demand
- Mark as New
- Bookmark
- Subscribe
- Mute
- Subscribe to RSS Feed
- Permalink
- Report Inappropriate Content
thank you very much Gysbert, you were right. I was working on a pivot chart, therefore it didn't allow minicharts!
very helpful
Alessandra