Unlock a world of possibilities! Login now and discover the exclusive benefits awaiting you.
- Qlik Community
- :
- All Forums
- :
- QlikView App Dev
- :
- Re: How to create a pivot table with multi levels ...
Options
- Subscribe to RSS Feed
- Mark Topic as New
- Mark Topic as Read
- Float this Topic for Current User
- Bookmark
- Subscribe
- Mute
- Printer Friendly Page
Turn on suggestions
Auto-suggest helps you quickly narrow down your search results by suggesting possible matches as you type.
Showing results for
Creator
2018-11-07
04:01 PM
- Mark as New
- Bookmark
- Subscribe
- Mute
- Subscribe to RSS Feed
- Permalink
- Report Inappropriate Content
How to create a pivot table with multi levels of headers?
Hi,
I have raw data in the attached qvw file.
I need to count how many prodId marked as "Senior" for each team in each region (Global vs EMEA) , and same to Non-Senior ones.
The final table should look like below,
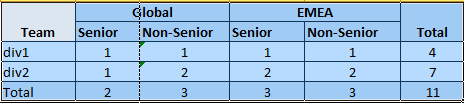
How can I get such a table in QV?
Thanks,
Michael
1,039 Views
1 Solution
Accepted Solutions
Master II
2018-11-07
04:33 PM
- Mark as New
- Bookmark
- Subscribe
- Mute
- Subscribe to RSS Feed
- Permalink
- Report Inappropriate Content
975 Views
4 Replies
Master II
2018-11-07
04:33 PM
- Mark as New
- Bookmark
- Subscribe
- Mute
- Subscribe to RSS Feed
- Permalink
- Report Inappropriate Content
see attached file.
hope this helps
976 Views
Employee
2018-11-07
04:50 PM
- Mark as New
- Bookmark
- Subscribe
- Mute
- Subscribe to RSS Feed
- Permalink
- Report Inappropriate Content
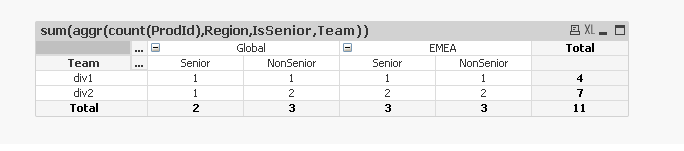
Hi Michael,
I have almost got it, but the totals are broken out by Senior/Non-Senior, see attached.
975 Views
Creator
2018-11-07
05:06 PM
Author
- Mark as New
- Bookmark
- Subscribe
- Mute
- Subscribe to RSS Feed
- Permalink
- Report Inappropriate Content
Thank you so much Frank! I appreciate it!
Creator
2018-11-07
05:55 PM
Author
- Mark as New
- Bookmark
- Subscribe
- Mute
- Subscribe to RSS Feed
- Permalink
- Report Inappropriate Content
Hi Lisa,
Thank you very much for the solution. I might need this solution also. 
975 Views