Unlock a world of possibilities! Login now and discover the exclusive benefits awaiting you.
- Qlik Community
- :
- All Forums
- :
- QlikView App Dev
- :
- Re: How to create a vertical reference line based ...
Options
- Subscribe to RSS Feed
- Mark Topic as New
- Mark Topic as Read
- Float this Topic for Current User
- Bookmark
- Subscribe
- Mute
- Printer Friendly Page
Turn on suggestions
Auto-suggest helps you quickly narrow down your search results by suggesting possible matches as you type.
Showing results for
Creator
2017-03-31
04:04 AM
- Mark as New
- Bookmark
- Subscribe
- Mute
- Subscribe to RSS Feed
- Permalink
- Report Inappropriate Content
How to create a vertical reference line based accumulation
Hi all,
I have a question related to reference line based on accumulation.
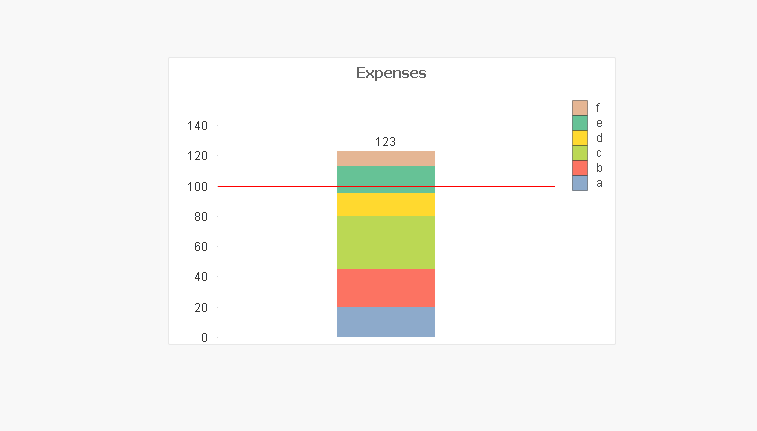
| Item | Price |
| a | 20 |
| b | 25 |
| c | 35 |
| d | 15 |
| e | 18 |
| f | 10 |
Plotted an Bar chart with the price and wanted to highlight once the accumulated price reaches 100 as shown in the attached graph.
Can anyone help me with the expression that uses the summed up prices to draw reference lines for the 100 $s?
871 Views
3 Replies
Creator
2017-03-31
05:08 AM
- Mark as New
- Bookmark
- Subscribe
- Mute
- Subscribe to RSS Feed
- Permalink
- Report Inappropriate Content
i dont think that is possible in Qlikview.
Some alternative:
719 Views
Creator
2017-03-31
05:28 AM
Author
- Mark as New
- Bookmark
- Subscribe
- Mute
- Subscribe to RSS Feed
- Permalink
- Report Inappropriate Content
Thank you Ionut Bostan.
I know this trick..but I am trying for other scenario that I mentioned. Looking for some tweaks..
719 Views
Champion III
2017-03-31
06:16 AM
- Mark as New
- Bookmark
- Subscribe
- Mute
- Subscribe to RSS Feed
- Permalink
- Report Inappropriate Content
it's only possible with a continuous x axes
Vineeth Pujari
If a post helps to resolve your issue, please accept it as a Solution.
If a post helps to resolve your issue, please accept it as a Solution.
719 Views