Unlock a world of possibilities! Login now and discover the exclusive benefits awaiting you.
- Qlik Community
- :
- All Forums
- :
- QlikView App Dev
- :
- Re: How to create averge line into multiple line c...
- Subscribe to RSS Feed
- Mark Topic as New
- Mark Topic as Read
- Float this Topic for Current User
- Bookmark
- Subscribe
- Mute
- Printer Friendly Page
- Mark as New
- Bookmark
- Subscribe
- Mute
- Subscribe to RSS Feed
- Permalink
- Report Inappropriate Content
How to create averge line into multiple line chart
Hi all,
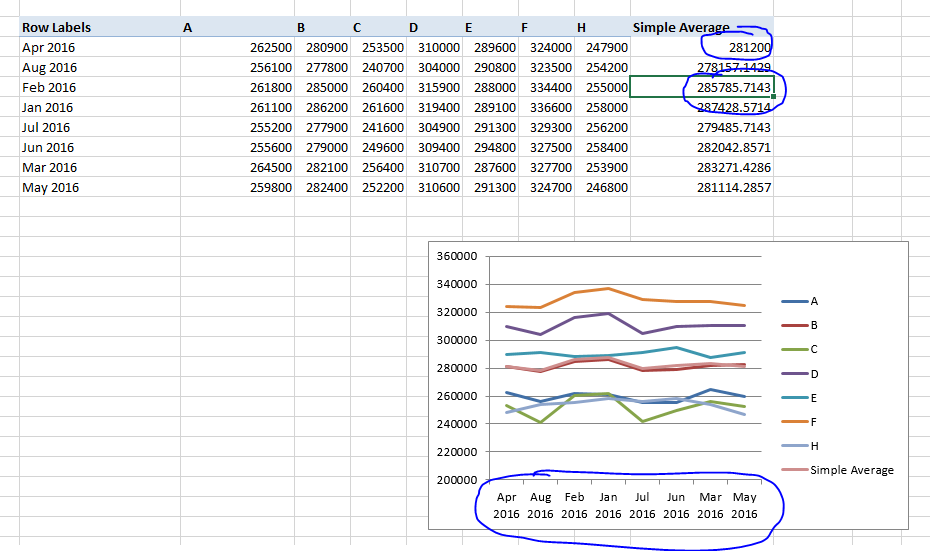
I attached my raw data and desired output in Excel File.The line chart is monthly basis. The chart will show monthly trend lines for each model, and also want to add the monthly simple average line for all models.
I also uploaded my QV file, it seemed wrong in expression. It is right for average but wrong for model trends.
Can anyone help me please.
- Mark as New
- Bookmark
- Subscribe
- Mute
- Subscribe to RSS Feed
- Permalink
- Report Inappropriate Content
Yes. The output is what I want to . But the average value seems not to be right, and one more question" Can I achieve this if I don't want to load any extra data?
- Mark as New
- Bookmark
- Subscribe
- Mute
- Subscribe to RSS Feed
- Permalink
- Report Inappropriate Content
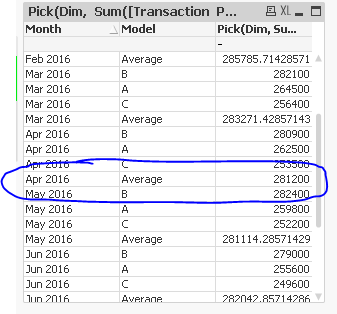
What's wrong with the average? Apr 2016 number for average is matching and so in Feb 2016 (did not check all the averages, but they should all match). The only thing different is the fact that your MonthYear is not sorted so the chart looks slightly different
There might be a very complicated way to do this without an Island Table, but I would suggest against it. This is a very simple one field Island Table which won't even impact a craziest of data models.
- Mark as New
- Bookmark
- Subscribe
- Mute
- Subscribe to RSS Feed
- Permalink
- Report Inappropriate Content
In you example, you choose Model=A&b&c, so the average means average of ABC, not all models
- Mark as New
- Bookmark
- Subscribe
- Mute
- Subscribe to RSS Feed
- Permalink
- Report Inappropriate Content
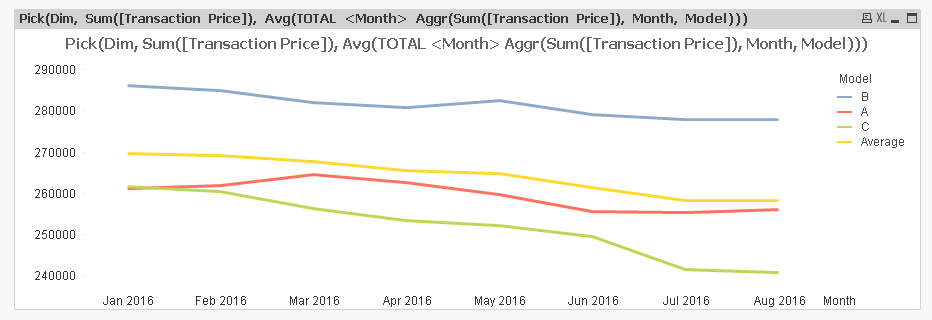
So you want to see only the average for the three models selected? Try this:
Pick(Dim, Sum([Transaction Price]), Avg(TOTAL <Month> Aggr(Sum([Transaction Price]), Month, Model)))
- Mark as New
- Bookmark
- Subscribe
- Mute
- Subscribe to RSS Feed
- Permalink
- Report Inappropriate Content
Thanks Sunny. This is what I want. But one more question, Can I do this base on my data? I mean if I don't want to load extra dim data.
- Mark as New
- Bookmark
- Subscribe
- Mute
- Subscribe to RSS Feed
- Permalink
- Report Inappropriate Content
I did respond to that part of your question above:
"There might be a very complicated way to do this without an Island Table, but I would suggest against it. This is a very simple one field Island Table which won't even impact a craziest of data models."
- Mark as New
- Bookmark
- Subscribe
- Mute
- Subscribe to RSS Feed
- Permalink
- Report Inappropriate Content
If you really want to do this without Island Table, may be mrkachhiaimp can share a sample which we worked on when we were playing around with this idea of not creating an Island table 
Off to sleep now....
Best,
Sunny
- Mark as New
- Bookmark
- Subscribe
- Mute
- Subscribe to RSS Feed
- Permalink
- Report Inappropriate Content
Cool. Ok. I understand.
Can I set this question more complicated?
In the above example, average is simple average. If I want to use another weighted average line to replace simple average, can it be realized?
The logic for weighted average is (sumproduct of price and sales) /sum of sales.
Sorry for occupying so much time.
Really appreciate!!!
- Mark as New
- Bookmark
- Subscribe
- Mute
- Subscribe to RSS Feed
- Permalink
- Report Inappropriate Content
Yes sir... make it complicated, but I won't be able to get to this until tomorrow morning.
Best,
Sunny
- Mark as New
- Bookmark
- Subscribe
- Mute
- Subscribe to RSS Feed
- Permalink
- Report Inappropriate Content
Sure. Have a nice sleep.
I will wait for you for the answer!
Thanks again.
Jerry