Unlock a world of possibilities! Login now and discover the exclusive benefits awaiting you.
- Qlik Community
- :
- All Forums
- :
- QlikView App Dev
- :
- Re: How to create following table
- Subscribe to RSS Feed
- Mark Topic as New
- Mark Topic as Read
- Float this Topic for Current User
- Bookmark
- Subscribe
- Mute
- Printer Friendly Page
- Mark as New
- Bookmark
- Subscribe
- Mute
- Subscribe to RSS Feed
- Permalink
- Report Inappropriate Content
How to create following table
Hi,
Have below scenario.
Below is the sample data.
| Company | Metric | Qtr | Value |
| a | Sales | Q1'17 | 590 |
| a | Sales | Q2'17 | 572 |
| a | Sales | Q3'17 | 889 |
| a | Sales | Q4'17 | 793 |
| a | Sales | Q1'18 | 784 |
| a | Sales | Q2'18 | 758 |
| a | Sales | Q3'18 | 746 |
| a | Sales | Q4'18 | 268 |
| b | Sales | Q1'17 | 561 |
| b | Sales | Q2'17 | 968 |
| b | Sales | Q3'17 | 627 |
| b | Sales | Q4'17 | 660 |
| b | Sales | Q1'18 | 999 |
| b | Sales | Q2'18 | 664 |
| b | Sales | Q3'18 | 324 |
| b | Sales | Q4'18 | 617 |
| a | Expenses | Q1'17 | 127 |
| a | Expenses | Q2'17 | 98 |
| a | Expenses | Q3'17 | 128 |
| a | Expenses | Q4'17 | 138 |
| a | Expenses | Q1'18 | 71 |
| a | Expenses | Q2'18 | 116 |
| a | Expenses | Q3'18 | 54 |
| a | Expenses | Q4'18 | 147 |
| b | Expenses | Q1'17 | 99 |
| b | Expenses | Q2'17 | 102 |
| b | Expenses | Q3'17 | 87 |
| b | Expenses | Q4'17 | 56 |
| b | Expenses | Q1'18 | 118 |
| b | Expenses | Q2'18 | 133 |
| b | Expenses | Q3'18 | 146 |
| b | Expenses | Q4'18 | 54 |
Trying to get the below comparison table

Can I fit all these in a single Table? I presume NO, in that case do I need to plot 3 different set of Values
(1. Absolute Values 2. Quarterly difference: Ex: Q1'18-Q1'17... 3. Quarterly difference proposition : Ex: Q'18/Q1'17 -1 )
I am unable to get the 2nd and 3rd set of Values (i.e Diff, propositions).
Can anyone help me?
- « Previous Replies
-
- 1
- 2
- Next Replies »
- Mark as New
- Bookmark
- Subscribe
- Mute
- Subscribe to RSS Feed
- Permalink
- Report Inappropriate Content
Don't follow... can you elaborate?
- Mark as New
- Bookmark
- Subscribe
- Mute
- Subscribe to RSS Feed
- Permalink
- Report Inappropriate Content
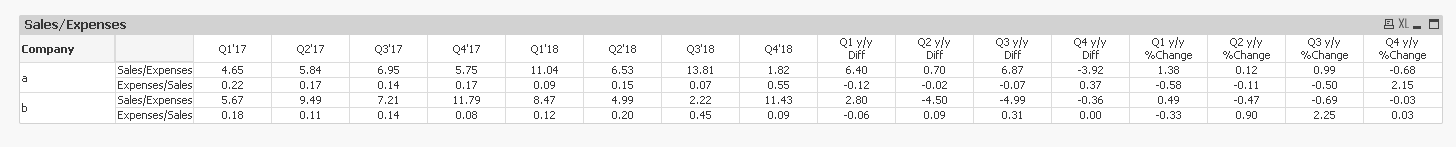
in above table , Expenses/Sales Metric for company a, Q1 y/y Diff has Negative Value ( -0.12), I am trying the highlight this value with RED font Using Expressions Tab (Text Format - the option that we get once we expand the Expression). But I couldn't succeed.
I want to highlight all negative metric results.
| Company | Dim | Q1'17 | Q2'17 | Q3'17 | Q4'17 | Q1'18 | Q2'18 | Q3'18 | Q4'18 | Q1 y/y Diff | Q2 y/y Diff | Q3 y/y Diff | Q4 y/y Diff | Q1 y/y %Change | Q2 y/y %Change | Q3 y/y %Change | Q4 y/y %Change |
| a | Sales/Expenses | 4.65 | 5.84 | 6.95 | 5.75 | 11.04 | 6.53 | 13.81 | 1.82 | 6.40 | 0.70 | 6.87 | -3.92 | 1.38 | 0.12 | 0.99 | -0.68 |
| a | Expenses/Sales | 0.22 | 0.17 | 0.14 | 0.17 | 0.09 | 0.15 | 0.07 | 0.55 | -0.12 | -0.02 | -0.07 | 0.37 | -0.58 | -0.11 | -0.50 | 2.15 |
| b | Sales/Expenses | 5.67 | 9.49 | 7.21 | 11.79 | 8.47 | 4.99 | 2.22 | 11.43 | 2.80 | -4.50 | -4.99 | -0.36 | 0.49 | -0.47 | -0.69 | -0.03 |
| b | Expenses/Sales | 0.18 | 0.11 | 0.14 | 0.08 | 0.12 | 0.20 | 0.45 | 0.09 | -0.06 | 0.09 | 0.31 | 0.00 | -0.33 | 0.90 | 2.25 | 0.03 |
Is my question clear now?
- Mark as New
- Bookmark
- Subscribe
- Mute
- Subscribe to RSS Feed
- Permalink
- Report Inappropriate Content
Check attached

Now if we may, please close this thread by marking correct and helpful responses and keep any further additions for another thread. The reason I ask this is because we have already tried to work on multiple things on this thread and it might make it easy for future readers if we stop this here and create new thread with a better heading for add-on requirements.
Best,
Sunny
- Mark as New
- Bookmark
- Subscribe
- Mute
- Subscribe to RSS Feed
- Permalink
- Report Inappropriate Content
Thank you Sunny for all the extended support
- « Previous Replies
-
- 1
- 2
- Next Replies »