Unlock a world of possibilities! Login now and discover the exclusive benefits awaiting you.
- Qlik Community
- :
- All Forums
- :
- QlikView App Dev
- :
- Re: Re: How to create select distinct from list bo...
- Subscribe to RSS Feed
- Mark Topic as New
- Mark Topic as Read
- Float this Topic for Current User
- Bookmark
- Subscribe
- Mute
- Printer Friendly Page
- Mark as New
- Bookmark
- Subscribe
- Mute
- Subscribe to RSS Feed
- Permalink
- Report Inappropriate Content
How to create select distinct from list box selected value....
I want to not need to select all other values and just select onr and get all except that registries and also sum the values for some fiels where multiple same value exist one showing total for that sum value .
1
2
3
4
I select 1 and get all records for 2.3.4 and if i have for 2 lets say 3 entries with value 1,2,3 to show 2 with column value 6
- « Previous Replies
-
- 1
- 2
- Next Replies »
- Mark as New
- Bookmark
- Subscribe
- Mute
- Subscribe to RSS Feed
- Permalink
- Report Inappropriate Content
Do you want sum all the entries except selected values?
- Mark as New
- Bookmark
- Subscribe
- Mute
- Subscribe to RSS Feed
- Permalink
- Report Inappropriate Content
No anlu ,first i need to get all values different from column except the one i will select ,after those values have other column with values that some i will need to sum ,some divide depending but only for the case where i have records more then one.
Like: If i select 1 in the table box i will have : for A column from list box i will have in table box:2,3,4 with let say sum that will be 52 and for 5 let say divide .... to ... (main problem is to make the the selection to show other then other stuff i can do )
A B
1 10
2 20
3 30
4 40
4 12
5 ...
5 ...
- Mark as New
- Bookmark
- Subscribe
- Mute
- Subscribe to RSS Feed
- Permalink
- Report Inappropriate Content
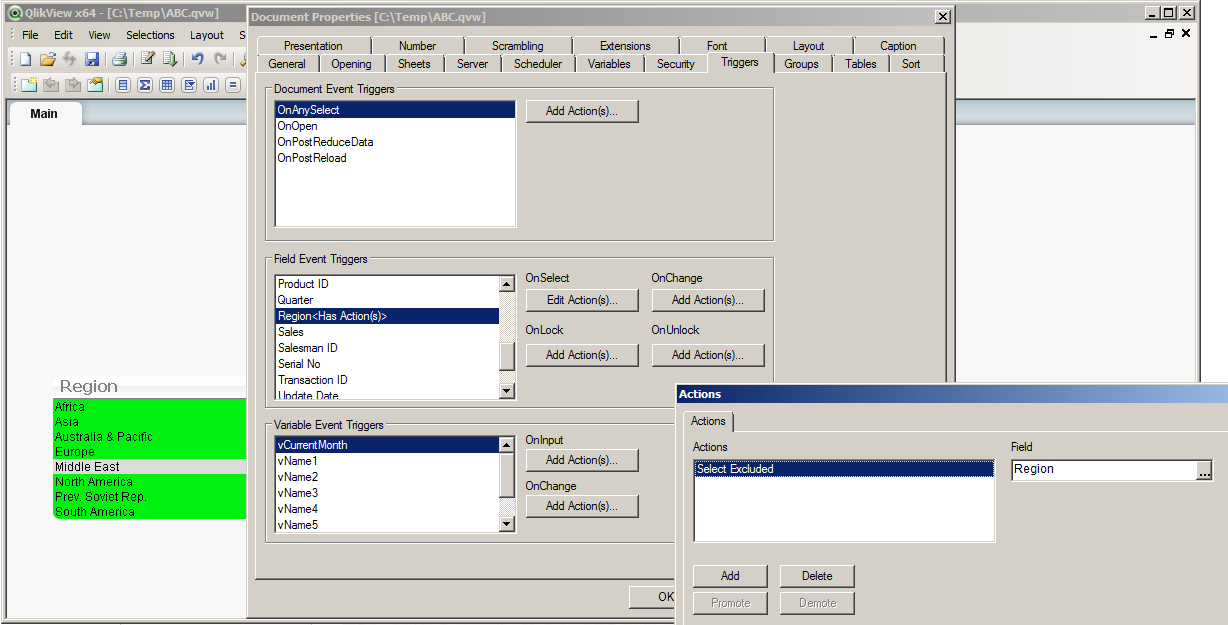
Under Document Propertes -> Triggers , add a 'on select' trigger for the field in question and add an action 'select excluded' . Enter the same field name for the action.
Attached is a short example
- Mark as New
- Bookmark
- Subscribe
- Mute
- Subscribe to RSS Feed
- Permalink
- Report Inappropriate Content
Can you offer a writen example for the trigger and select excluded is an mark /unmarked section in proprieties that i read in a post but didn t do anything when i did it but will try doing all you said,just i don t have full version so can really see more then script edit code so an example writen expression needed would help a lot.
- Mark as New
- Bookmark
- Subscribe
- Mute
- Subscribe to RSS Feed
- Permalink
- Report Inappropriate Content
Does this help ?
The list box shows the field 'region'. Then i added a trigger for 'onselect' region with the action 'select excluded' on the field region.
- Mark as New
- Bookmark
- Subscribe
- Mute
- Subscribe to RSS Feed
- Permalink
- Report Inappropriate Content
Use SET ANALYIS to tweak the user's selection in the context of an individual chart or table in the UI.
For example, if a user selects the Region 'North America' , the following expression in a chart will make the chart only show Regions that DO NOT equal 'North America'.
sum( {$<Region -={'$(=Only(Region))'}>} Sales)
The '-=' is a way of saying 'NOT' . If the user makes multiple selections, the syntax would have to be improved to accommodate that scenario as the above is only for 1 selection at a time.
- Mark as New
- Bookmark
- Subscribe
- Mute
- Subscribe to RSS Feed
- Permalink
- Report Inappropriate Content
I need only for a selection so it should be ok in that regard having trouble thinking how to sum up into one line the where i have copies like i said in first post for 2 linies for 4 to show only one .
A B C D to make A C D
1 261 x 10 2 y 20 for sum of then example (what i need out)
2 531 y 20 3 z 80
3 101 z 30
3 531 z 50
load * from ...
Where A not 1
and where i have
The example with region and sales as i understand will sum up all not only for where i have same column like in my exampel 3 but all sales =100 and that not what i want.
- Mark as New
- Bookmark
- Subscribe
- Mute
- Subscribe to RSS Feed
- Permalink
- Report Inappropriate Content
If you sum(D) then you will get 30+50=80.
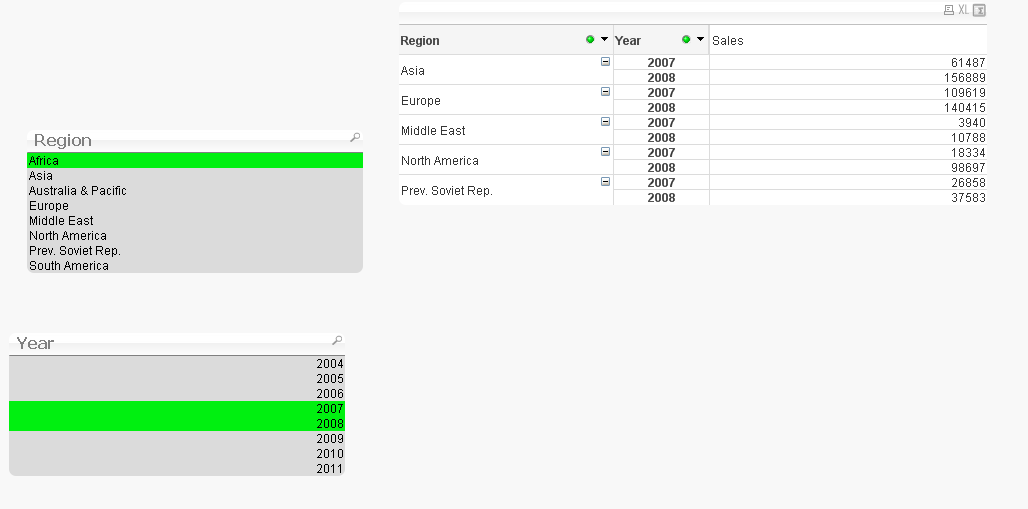
Take a look at below:
With 'Africa' selected, it shows the other Regions . But with 2007 and 2008 selected, it shows 2007 and 2008 years for those other Regions
All i used was Region and Year as dimensions with an expression of:
sum( {$<Region =- {'$(=Only(Region))'}>} Sales)
- Mark as New
- Bookmark
- Subscribe
- Mute
- Subscribe to RSS Feed
- Permalink
- Report Inappropriate Content
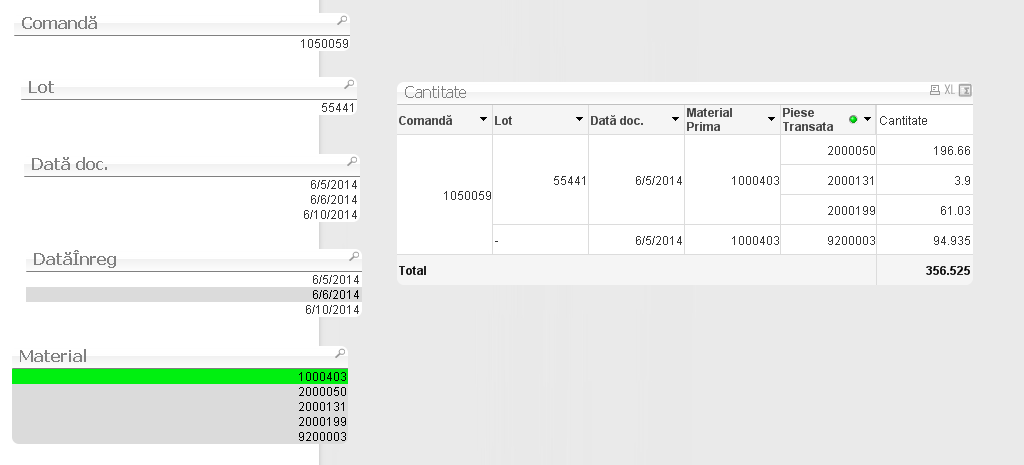
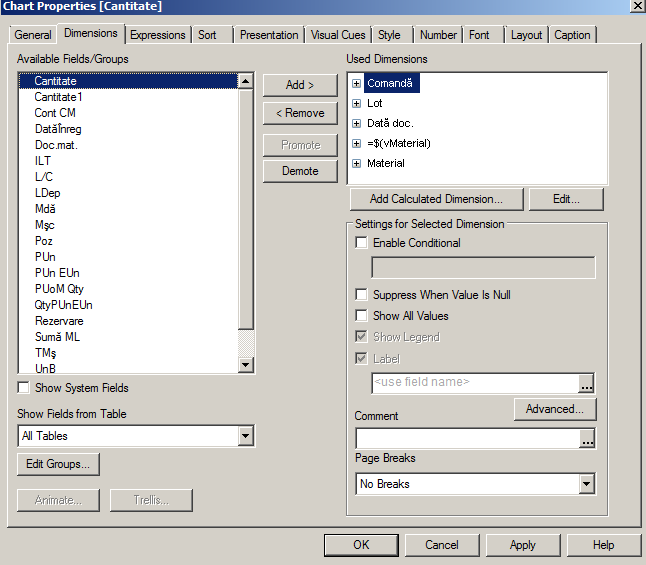
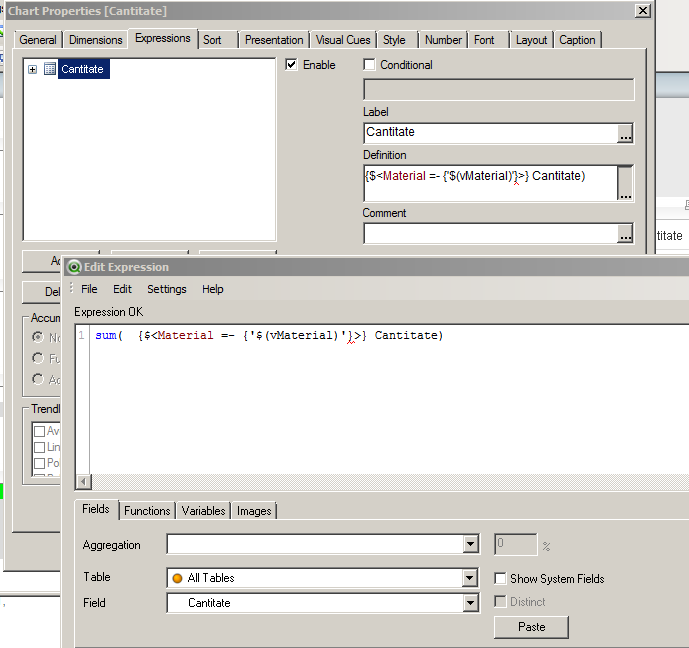
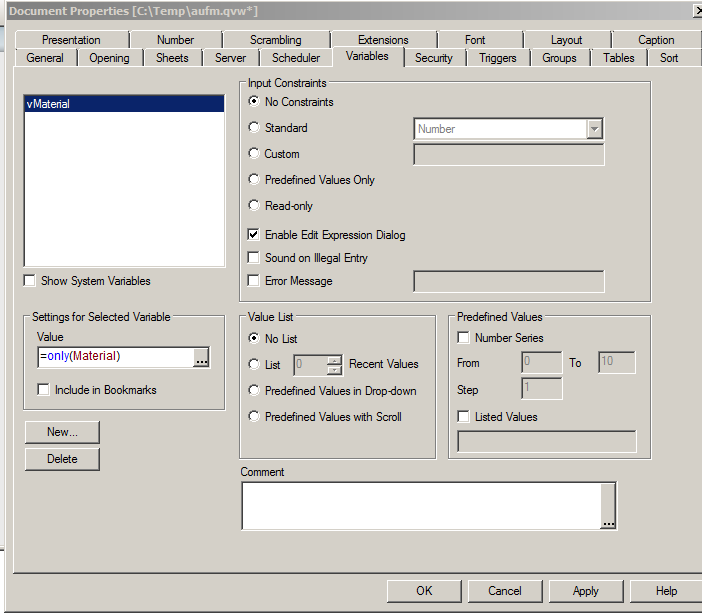
I loaded the AUFM data with the load script below. Then I created a PIVOT CHART that looks like the following. Two points:
1. 'Material' column is a constant and is just the value of the Material that the user selects. It is stored as a variable: Material = only(Material)
2. The expression causes the filter that you want. Specifically the SET statement "{$<Material =- {'$(vMaterial)'}>}" will cause only OTHER Material to show (opposite of user selection). Here is the full expression
sum( {$<Material =- {'$(vMaterial)'}>} Cantitate)
3. to add more expressions just repeat the SET statement in each expression
LOAD Doc.mat.,
[Dată doc.],
DatăÎnreg,
TMş,
Material,
LDep,
Lot,
[L/C],
[Sumă ML],
Mdă,
Cantitate,
UnB,
Cantitate1,
UnI,
ILT,
Comandă,
Rezervare,
Poz,
Mşc,
[Cont CM],
[PUoM Qty],
PUn,
QtyPUnEUn,
[PUn EUn]
FROM
(ooxml, embedded labels, table is Sheet1);
- « Previous Replies
-
- 1
- 2
- Next Replies »