Unlock a world of possibilities! Login now and discover the exclusive benefits awaiting you.
- Qlik Community
- :
- All Forums
- :
- QlikView App Dev
- :
- Re: How to create this pivot ?
- Subscribe to RSS Feed
- Mark Topic as New
- Mark Topic as Read
- Float this Topic for Current User
- Bookmark
- Subscribe
- Mute
- Printer Friendly Page
- Mark as New
- Bookmark
- Subscribe
- Mute
- Subscribe to RSS Feed
- Permalink
- Report Inappropriate Content
How to create this pivot ?
Hello,
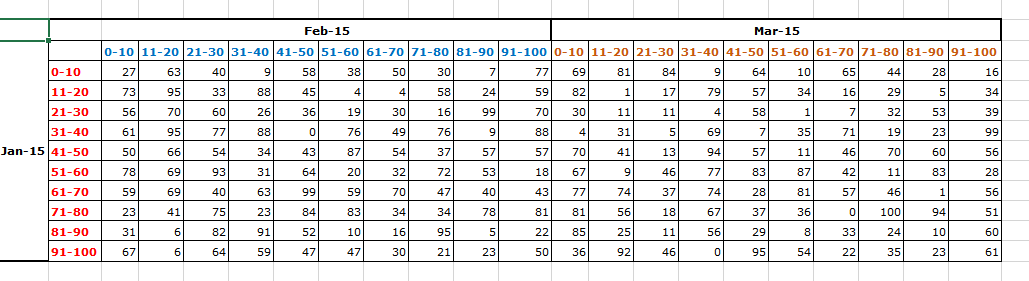
I am trying to create the following pivot
Basically, there is a period selector which is used to Select Jan - 15, and the bands on the left (in red) are the aging bands.
I want to represent that there are 73 people who were in the band 11 - 20 in jan-15 moved to 0 - 10 in Feb-15 and 82 in 0 - 10 in mar - 15
I am trying to show if there is a pattern in movement between bands across periods
Is this even possible ?
Please advise.
Thanks
- « Previous Replies
- Next Replies »
Accepted Solutions
- Mark as New
- Bookmark
- Subscribe
- Mute
- Subscribe to RSS Feed
- Permalink
- Report Inappropriate Content
Here you go, got it to work (PFA)
Thanks to Alternate state in calculated dimension - Set analysis
Best,
Sunny
- Mark as New
- Bookmark
- Subscribe
- Mute
- Subscribe to RSS Feed
- Permalink
- Report Inappropriate Content
Without looking your data it's difficult to give you answer. Can you provide some sample dummy data in excel file to work?
- Mark as New
- Bookmark
- Subscribe
- Mute
- Subscribe to RSS Feed
- Permalink
- Report Inappropriate Content
Hi,
As Manish said, dummy data required for the related suggestion and discussion.
As per my understandability of the scenario, it is possible to do it with class() function, which will creates regular buckets like 1-10,11-20...etc, use count() function along with that for counting the number of values which fall under that bucket.
The fallowing thread may help you... Lavanyar
Thanks
- Mark as New
- Bookmark
- Subscribe
- Mute
- Subscribe to RSS Feed
- Permalink
- Report Inappropriate Content
I have already created the buckets using class.
The problem I have is to display the buckets (same dimension) as two different dimensions across the pivot.
Attached is sample data and what I wish to achieve is on the right side tabulated form.
I cannot share the actual data as its sensitive information.
- Mark as New
- Bookmark
- Subscribe
- Mute
- Subscribe to RSS Feed
- Permalink
- Report Inappropriate Content
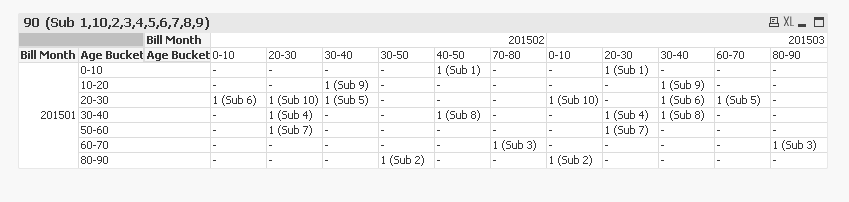
Is this close to what you wanted? PFA
Best,
Sunny
- Mark as New
- Bookmark
- Subscribe
- Mute
- Subscribe to RSS Feed
- Permalink
- Report Inappropriate Content
My version of it 
By the way this could be an excellent candiate for a Scatter Chart / Bubble Chart visualization too...
- Mark as New
- Bookmark
- Subscribe
- Mute
- Subscribe to RSS Feed
- Permalink
- Report Inappropriate Content
Hello Sunny,
Thank you very much for the idea. Yes this is close.
But in my case, I am creating the buckets on the fly by taking a user input so I cannot replicate the Month or the Bucket dimension in the table.
Also, the case above the user input for month was fixed to 201501 but in the application it will be based on a list box selection. So they can choose 201502 and I should show all remaining months i.e. 201501 and 201503 .
I was trying to create a pivot table with two dimensions (of different alternate states) but that doesn't seem to work 
- Mark as New
- Bookmark
- Subscribe
- Mute
- Subscribe to RSS Feed
- Permalink
- Report Inappropriate Content
Your second concern can definitely be addressed. Instead of using static value for the if statement I can use variables which are driven by the user's selection in list box.
To your 1st point. What bucket is user's input?
Best,
Sunny
- Mark as New
- Bookmark
- Subscribe
- Mute
- Subscribe to RSS Feed
- Permalink
- Report Inappropriate Content
Please find another version which is dynamic for user selection on the Bill Month. PFA
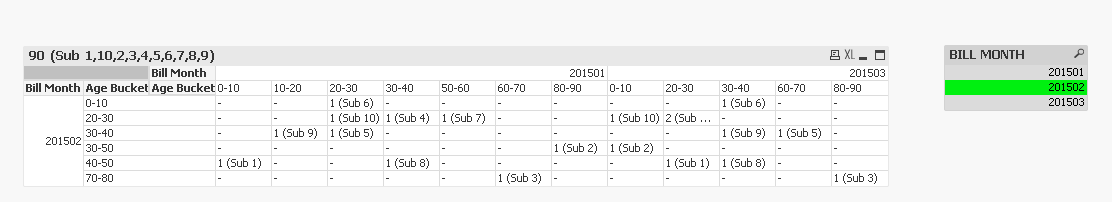
Best,
Sunny
- Mark as New
- Bookmark
- Subscribe
- Mute
- Subscribe to RSS Feed
- Permalink
- Report Inappropriate Content
Well, both of them are age buckets which are derived from the same field in the table - aging days.
So, essentially its a bucket created with a class function
class(sum(aging_days),v_age_bucket) where v_age_bucket is from an input box.
- « Previous Replies
- Next Replies »