Unlock a world of possibilities! Login now and discover the exclusive benefits awaiting you.
- Qlik Community
- :
- All Forums
- :
- QlikView App Dev
- :
- Re: How to create total for each column in pivot t...
- Subscribe to RSS Feed
- Mark Topic as New
- Mark Topic as Read
- Float this Topic for Current User
- Bookmark
- Subscribe
- Mute
- Printer Friendly Page
- Mark as New
- Bookmark
- Subscribe
- Mute
- Subscribe to RSS Feed
- Permalink
- Report Inappropriate Content
How to create total for each column in pivot table?
Hi , I'm having problem to display the total of each column in the pivot table in my dashboard. Can anyone help me?
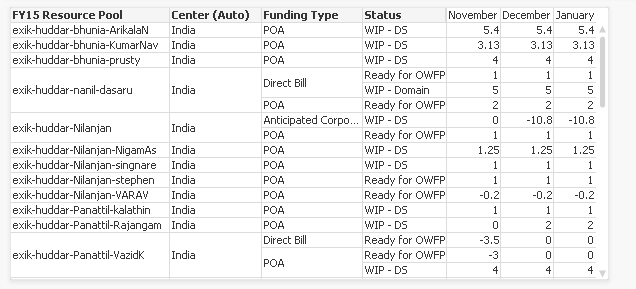
This is my pivot table
I want to display one more row in the pivot table and shows the total of the columns November, December and January.
Can anyone helps me with that?
Regards,
Kama
Accepted Solutions
- Mark as New
- Bookmark
- Subscribe
- Mute
- Subscribe to RSS Feed
- Permalink
- Report Inappropriate Content
Kama,
you need to do following to enable Totals:
Presentation Tab -> Dimensions and Expressions-> Select your first dimension "FY15 Resource Pool"
-> mark checkbox "Show Partital Sums" and Subtotals "Subtotals at Bottom"
The last row should show now Totals for your month columns.
Regards,
Ronny
Please see one of my pivot tables as example:

- Mark as New
- Bookmark
- Subscribe
- Mute
- Subscribe to RSS Feed
- Permalink
- Report Inappropriate Content
Hi Kama,
In the Presentation tab of the pivot table's properties, select your dimension and check the flag "Show Partial Sums".
- Mark as New
- Bookmark
- Subscribe
- Mute
- Subscribe to RSS Feed
- Permalink
- Report Inappropriate Content
Hi Kama,
Does your Screenshot not show a straight table ?
Did you checked inside the chart properties:
1. Expressions Tab -> Total Mode -> Expression Total
If you need Sub Totals for Pivot table:
Chart properties -> PresentationTab -> Dimensions and Expressions -> Show Partital Sums
Best regards,
Ronny
- Mark as New
- Bookmark
- Subscribe
- Mute
- Subscribe to RSS Feed
- Permalink
- Report Inappropriate Content
Hi Ronny,
I guess it's a pivot table that may have the option "Always Fully Expanded" checked.
The straight table would basically repeat the dimension's values over the rows.
- Mark as New
- Bookmark
- Subscribe
- Mute
- Subscribe to RSS Feed
- Permalink
- Report Inappropriate Content
Hi,
Can I display the overall total in the pivot table? I want to add a new row that display the overall total of the column November, December and January. Can I do that in pivot table?
- Mark as New
- Bookmark
- Subscribe
- Mute
- Subscribe to RSS Feed
- Permalink
- Report Inappropriate Content
Hi,
thanks for the hint. You're right.
Regards,
Ronny
- Mark as New
- Bookmark
- Subscribe
- Mute
- Subscribe to RSS Feed
- Permalink
- Report Inappropriate Content
Kama,
you need to do following to enable Totals:
Presentation Tab -> Dimensions and Expressions-> Select your first dimension "FY15 Resource Pool"
-> mark checkbox "Show Partital Sums" and Subtotals "Subtotals at Bottom"
The last row should show now Totals for your month columns.
Regards,
Ronny
Please see one of my pivot tables as example:

- Mark as New
- Bookmark
- Subscribe
- Mute
- Subscribe to RSS Feed
- Permalink
- Report Inappropriate Content
I can display it now...
Thanks Ronny!
- Mark as New
- Bookmark
- Subscribe
- Mute
- Subscribe to RSS Feed
- Permalink
- Report Inappropriate Content
Hi,
I am new to Qlikview,In this case which dimension should be selected to show totals at the bottom of the table. Because I tried "show partial sums" and it was showing totals in between rows.
Regards,
Navdeep
- Mark as New
- Bookmark
- Subscribe
- Mute
- Subscribe to RSS Feed
- Permalink
- Report Inappropriate Content
Hi Navdeep,
You need to select your first dimension(highest dimension) because for the pivot table it is just Subtotal.
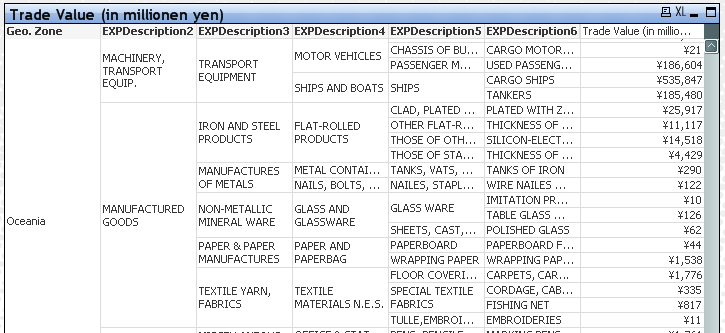
Please see following screenshot:

In this Example I need to select "Geo Zone" Dimension only under Presentation Tab->
Dimensions & Expressions and Subtotals at the Bottom.
If I would select another dimension I also would get the Subtotals between, depending which dimension is select.
Regards,
Ronny