Unlock a world of possibilities! Login now and discover the exclusive benefits awaiting you.
- Qlik Community
- :
- All Forums
- :
- QlikView App Dev
- :
- Re: How to customize the pivot table
- Subscribe to RSS Feed
- Mark Topic as New
- Mark Topic as Read
- Float this Topic for Current User
- Bookmark
- Subscribe
- Mute
- Printer Friendly Page
- Mark as New
- Bookmark
- Subscribe
- Mute
- Subscribe to RSS Feed
- Permalink
- Report Inappropriate Content
How to customize the pivot table
Hi All,
I have attached a QV application, which will have a pivot table.
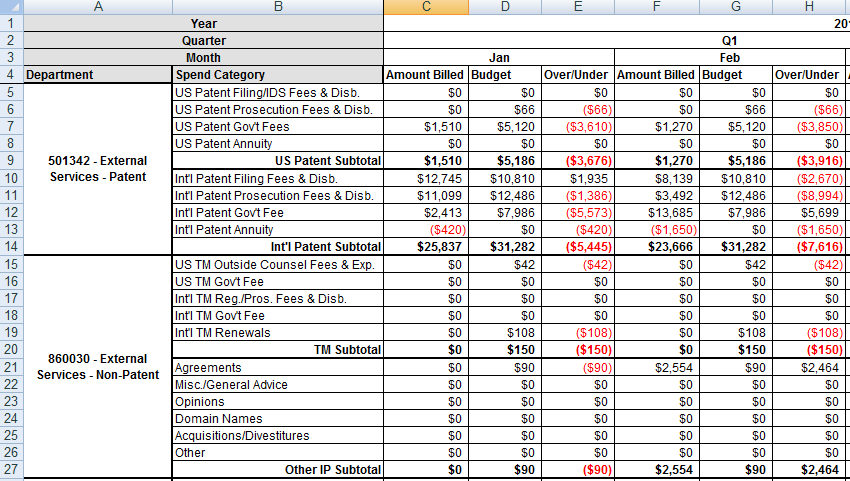
Below is the format of a excel which need to be achieved in pivot table. Spend category field is categorized as shown in the picture and sub total has been calculated.

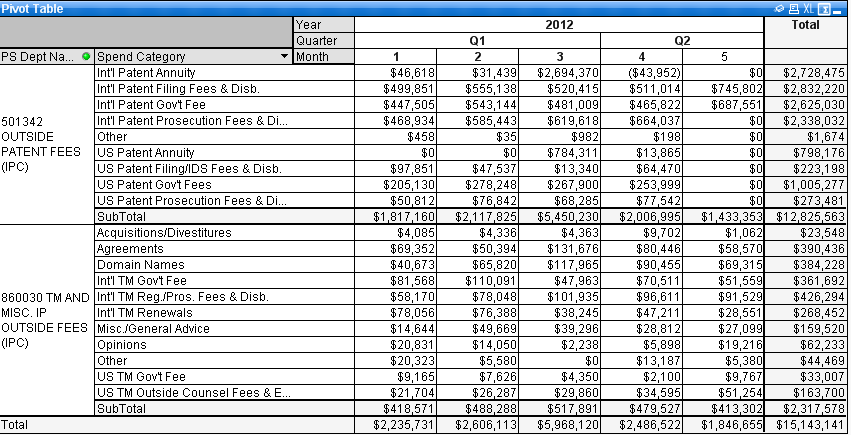
But the pivot table i have created in QV is as below

How can we get the exact format of excel in pivot table for spend category.
Either we need to get the order of spend category for dept 860030 or we need to get the exact excel format.
| US TM Outside Counsel Fees & Exp. |
| US TM Gov't Fee |
| Int'l TM Reg./Pros. Fees & Disb. |
| Int'l TM Gov't Fee |
| Int'l TM Renewals |
| Agreements |
| Misc./General Advice |
| Opinions |
| Domain Names |
| Acquisitions/Divestitures |
| Other |
Please a solution for this.
Regards,
Gerard
- Mark as New
- Bookmark
- Subscribe
- Mute
- Subscribe to RSS Feed
- Permalink
- Report Inappropriate Content
I think that one way to solve your problem is adding another field to your data where you group the distinct spend categories and use this new field in your pivot table as a dimension before spend category dimension... if you attach the .xls that you use in your .qvw i can help you to modify the script for making this...
also the sort order can be solved with this idea... Regards!
- Mark as New
- Bookmark
- Subscribe
- Mute
- Subscribe to RSS Feed
- Permalink
- Report Inappropriate Content
Hi Gerard,
The excel format shows Budget,OverUnder as additional columns under Month Dimension unlike QV format.
For this, to be achived you will have to add additional expressions for Budget and OverUnder.
Please find the attached qvw.
Hope this helps.
Regards,
Snehal Bhosle