Unlock a world of possibilities! Login now and discover the exclusive benefits awaiting you.
- Qlik Community
- :
- All Forums
- :
- QlikView App Dev
- :
- Re: How to define line style of a chart according ...
- Subscribe to RSS Feed
- Mark Topic as New
- Mark Topic as Read
- Float this Topic for Current User
- Bookmark
- Subscribe
- Mute
- Printer Friendly Page
- Mark as New
- Bookmark
- Subscribe
- Mute
- Subscribe to RSS Feed
- Permalink
- Report Inappropriate Content
How to define line style of a chart according to a specific value
Hi guys,
I need your help because I've tried to design a very basic chart and I have some issues.
-> You can see it just by clicking on the bottom button.
You can see a green line and a yellow one.
I thought It could be smart to change the line style according to the value of yellow line.
I mean, when the part of the yellow line is under the green one, i would like have a dote line.
In the same way, a full yellow line when it is above the green one.
get it ?
Actually, it works but not well !
Any ideas ?
I've done : Chart-> ¨Properties -> Line Style -> IF( value Yellow < value green, '<S3>')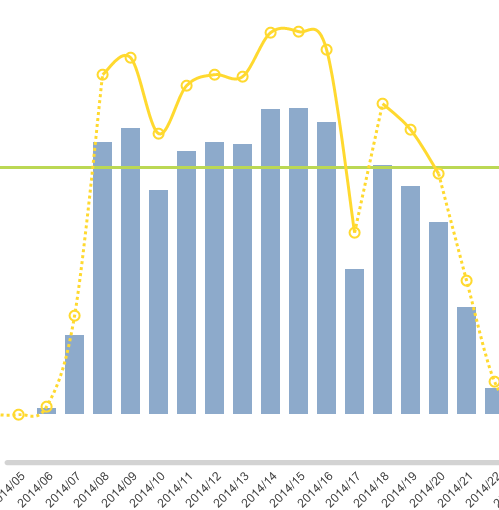
Cdt,
Benjamin Drouin
Consultant BI
Accepted Solutions
- Mark as New
- Bookmark
- Subscribe
- Mute
- Subscribe to RSS Feed
- Permalink
- Report Inappropriate Content
- Mark as New
- Bookmark
- Subscribe
- Mute
- Subscribe to RSS Feed
- Permalink
- Report Inappropriate Content
Bon en fait,
c'est pas possible 😞