Unlock a world of possibilities! Login now and discover the exclusive benefits awaiting you.
- Qlik Community
- :
- All Forums
- :
- QlikView App Dev
- :
- Re: How to display a field that links to first rec...
- Subscribe to RSS Feed
- Mark Topic as New
- Mark Topic as Read
- Float this Topic for Current User
- Bookmark
- Subscribe
- Mute
- Printer Friendly Page
- Mark as New
- Bookmark
- Subscribe
- Mute
- Subscribe to RSS Feed
- Permalink
- Report Inappropriate Content
How to display a field that links to first record of an aggregate calculated dimension
Hi All,
I have a chart/graph where I currently display Sales (Y-axis) vs Customer (X-axis) using
Expression: sum(aggr(count( distinct Customer ID),Customer ID)))
Dimension: Customer
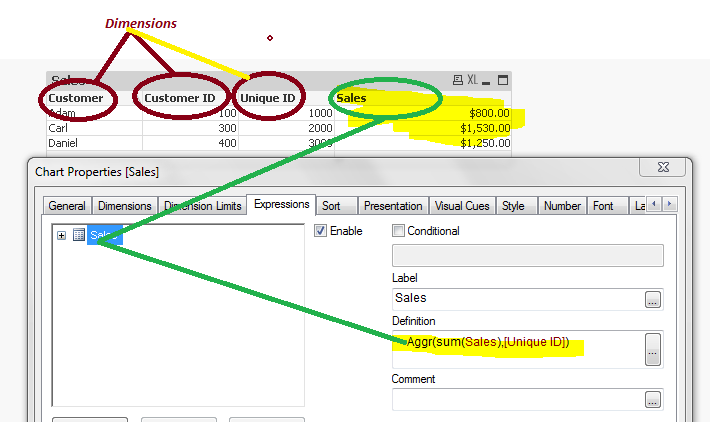
| Sales | Customer | Customer ID | Unique ID |
| $500 | Adam | 100 | 1000 |
| $200 | Alyssa | 200 | 1000 |
| $400 | Carl | 300 | 2000 |
| $900 | Daniel | 400 | 3000 |
| $100 | Andrew | 500 | 1000 |
| $430 | Candice | 600 | 2000 |
| $700 | Cory | 700 | 2000 |
| $350 | Denise | 800 | 3000 |
A new business logic requires that I group customers with same Unique ID for displaying instead of Customer ID, so I need to show something like the 1st Customer in the Unique ID grouping instead of each Customer per Customer ID.
I'm using aggr(Customer, Unique ID) for the new Dimension, but users obviously prefer to read text instead of a cryptic code.
However, I'm having some difficulty trying to show this. In addition, I suppose I have to change Expression to sum(aggr(count( distinct Unique ID),Unique ID)))
My expected output would be something like:
| Sales | Customer | Customer ID | Unique ID |
| $800 | Adam | 100 | 1000 |
| $1,530 | Carl | 600 | 2000 |
| $1,250 | Daniel | 400 | 3000 |
The data is calculated 'live' so a LOAD script with GROUP BY wouldn't do. I believe there should be a nice clean expression that would do the trick, though it's been eluding me  Not sure if it's a combination of only() or aggr() or some cryptic function.....????
What should I use for the new dimension in order to display Customer (based on Unique ID) for my requirement?
Can anyone help ? Thanks in advance!
- Mark as New
- Bookmark
- Subscribe
- Mute
- Subscribe to RSS Feed
- Permalink
- Report Inappropriate Content
Hi,
As per my knowledge peek function may help you!
Using Peek and Previous Functions Recursively to Help Transform Data
- Mark as New
- Bookmark
- Subscribe
- Mute
- Subscribe to RSS Feed
- Permalink
- Report Inappropriate Content
Hi hariprasadqv,
Thanks for your reply but I don't think you understand what I'm asking for.
Also I don't see how Peek and Previous can help, since you didn't provide any examples.
- Mark as New
- Bookmark
- Subscribe
- Mute
- Subscribe to RSS Feed
- Permalink
- Report Inappropriate Content
Hi William,
Could you please post sample data! so that i can line up.
- Mark as New
- Bookmark
- Subscribe
- Mute
- Subscribe to RSS Feed
- Permalink
- Report Inappropriate Content
I Think This could help u
| Sales | Customer | Customer ID |
| 800 | Adam | 100 |
| 1530 | Carl | 300 |
| 1250 | Daniel | 400 |
is this the output u were looking for
- Mark as New
- Bookmark
- Subscribe
- Mute
- Subscribe to RSS Feed
- Permalink
- Report Inappropriate Content
Hi,
This may help you.