Unlock a world of possibilities! Login now and discover the exclusive benefits awaiting you.
- Qlik Community
- :
- All Forums
- :
- QlikView App Dev
- :
- Re: How to display datas conditionned by datas in ...
- Subscribe to RSS Feed
- Mark Topic as New
- Mark Topic as Read
- Float this Topic for Current User
- Bookmark
- Subscribe
- Mute
- Printer Friendly Page
- Mark as New
- Bookmark
- Subscribe
- Mute
- Subscribe to RSS Feed
- Permalink
- Report Inappropriate Content
How to display datas conditionned by datas in another column?
I am working with a file such as follows:
| Mnemonic | Maturity_Two | STD_Two | Maturity_One | STD_One |
| FJWSH489 | 30Y | 204269,469 | 5Y | 206833,719 |
| KMYUC667 | 5Y | 274532,891 | 5Y | 277955,472 |
| PJMCM574 | 3Y | 177099,96 | 1Y | 177275,884 |
| HKHGV576 | 30Y | 47370,9541 | 5Y | 47964,9703 |
| MHYLG715 | 30Y | 372818,911 | 5Y | 377506,833 |
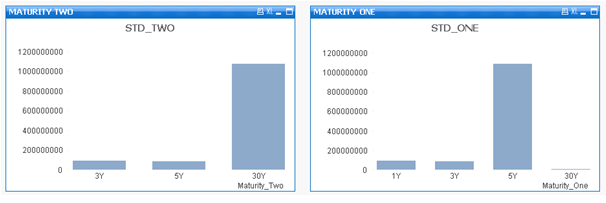
I want to display a chart summing STD_One and STD_Two if Maturity_One= Maturity_Two
Thanks a lot,
Thibaud
Accepted Solutions
- Mark as New
- Bookmark
- Subscribe
- Mute
- Subscribe to RSS Feed
- Permalink
- Report Inappropriate Content
Hi,
Like this
Test:
Load * Inline [
Mnemonic, Maturity_Two, STD_Two, Maturity_One, STD_One
FJWSH489, 30Y, 204269469, 5Y, 206833,719
KMYUC667, 5Y, 274532891, 5Y, 277955,472
PJMCM574, 3Y, 17709996, 1Y, 177275,884
HKHGV576, 30Y, 473709541, 5Y, 47964,9703
MHYLG715, 30Y, 372818911, 5Y, 377506,833
];
Test1:
Load Mnemonic,Maturity_Two AS Maturity,STD_Two as STD
Resident Test;
Load Mnemonic,Maturity_One AS Maturity,STD_One as STD
Resident Test;
Drop Table Test;
and this could be the chart
- Mark as New
- Bookmark
- Subscribe
- Mute
- Subscribe to RSS Feed
- Permalink
- Report Inappropriate Content
Hi
=Sum(If(Maturity_One = Maturity_Two, STD_One))
=Sum(If(Maturity_One = Maturity_Two, STD_Two))
HTH
Jonathan
- Mark as New
- Bookmark
- Subscribe
- Mute
- Subscribe to RSS Feed
- Permalink
- Report Inappropriate Content
Hi,
Please find attach document
regards,
Please appreciate our Qlik community members by giving Kudos for sharing their time for your query. If your query is answered, please mark the topic as resolved 🙂
- Mark as New
- Bookmark
- Subscribe
- Mute
- Subscribe to RSS Feed
- Permalink
- Report Inappropriate Content
use the below expression
=if(Maturity_Two=Maturity_One,Sum(STD_One)+sum(STD_Two))
Please find attachement
anant
- Mark as New
- Bookmark
- Subscribe
- Mute
- Subscribe to RSS Feed
- Permalink
- Report Inappropriate Content
The fact is they are NEVER equals in the same line, so if I use your solutions if displays: "no data".
Maturity_One and Maturity_Two are both buckets calculated using a barycentric projection.
Here are the two charts I want to be in one:

- Mark as New
- Bookmark
- Subscribe
- Mute
- Subscribe to RSS Feed
- Permalink
- Report Inappropriate Content
Hi,
can you post sample data,
Regards,
Please appreciate our Qlik community members by giving Kudos for sharing their time for your query. If your query is answered, please mark the topic as resolved 🙂
- Mark as New
- Bookmark
- Subscribe
- Mute
- Subscribe to RSS Feed
- Permalink
- Report Inappropriate Content
Hi,
Check the atatched app.
Regards
Kumar
- Mark as New
- Bookmark
- Subscribe
- Mute
- Subscribe to RSS Feed
- Permalink
- Report Inappropriate Content
Hi,
I'm a student and using a Personal Edition, could you please display your information in a form I can read?
Thank you in advance
Regards,
Thibaud
- Mark as New
- Bookmark
- Subscribe
- Mute
- Subscribe to RSS Feed
- Permalink
- Report Inappropriate Content
Hi,
Like this
Test:
Load * Inline [
Mnemonic, Maturity_Two, STD_Two, Maturity_One, STD_One
FJWSH489, 30Y, 204269469, 5Y, 206833,719
KMYUC667, 5Y, 274532891, 5Y, 277955,472
PJMCM574, 3Y, 17709996, 1Y, 177275,884
HKHGV576, 30Y, 473709541, 5Y, 47964,9703
MHYLG715, 30Y, 372818911, 5Y, 377506,833
];
Test1:
Load Mnemonic,Maturity_Two AS Maturity,STD_Two as STD
Resident Test;
Load Mnemonic,Maturity_One AS Maturity,STD_One as STD
Resident Test;
Drop Table Test;
and this could be the chart
- Mark as New
- Bookmark
- Subscribe
- Mute
- Subscribe to RSS Feed
- Permalink
- Report Inappropriate Content
That works, thank you so much!