Unlock a world of possibilities! Login now and discover the exclusive benefits awaiting you.
- Qlik Community
- :
- All Forums
- :
- QlikView App Dev
- :
- How to display the values against my selection?
- Subscribe to RSS Feed
- Mark Topic as New
- Mark Topic as Read
- Float this Topic for Current User
- Bookmark
- Subscribe
- Mute
- Printer Friendly Page
- Mark as New
- Bookmark
- Subscribe
- Mute
- Subscribe to RSS Feed
- Permalink
- Report Inappropriate Content
How to display the values against my selection?
Hi all
Small requirement.
1)I have country field. values India, Us , UK.
If I selected any one country I want to display remaining countries sales.
Ex :i am select Us I want display remaining countries India and UK sales.
2)same way 3 fields country, region, state.
If I selected any one country and state and region. Display the remaining country and state and region values
- Mark as New
- Bookmark
- Subscribe
- Mute
- Subscribe to RSS Feed
- Permalink
- Report Inappropriate Content
Hi Chaithnaya,
try this
sum({<country/={'India','Us','UK'}>}sales)
- Mark as New
- Bookmark
- Subscribe
- Mute
- Subscribe to RSS Feed
- Permalink
- Report Inappropriate Content
Interesting !!
Would you like to add Button to implement this? Or you want to draw without button. Can you confirm the same.
If button then it is easy to implement. Without we can do but we need to write expressions like 3 list boxes we can say.
- Mark as New
- Bookmark
- Subscribe
- Mute
- Subscribe to RSS Feed
- Permalink
- Report Inappropriate Content
Is this Okay ?

- Mark as New
- Bookmark
- Subscribe
- Mute
- Subscribe to RSS Feed
- Permalink
- Report Inappropriate Content
Hi chaitanya,
Do like this......
here i given example on regions.(in bar chart ,in that i displayed region wise sales)
your requirement is...
If you selected any one Region it want to display remaining Regions sales right,
take your dimension as region
and write expressions according to your regions..here i taken only 3 regions..

write your expressions like this:
=sum({<Region={'EU','NA'}>}[Final Price])
and
=sum({<Region={'APAC','NA'}>}[Final Price])
and
=sum({<Region={'APAC','EU'}>}[Final Price])
and
make conditional all the expressions as like shown in image:
by using these conditions,
=if(Match(GetFieldSelections(Region),'APAC'),1,0)
and
=if(Match(GetFieldSelections(Region),'EU'),1,0)
and
=if(Match(GetFieldSelections(Region),'NA'),1,0)
after making like this:
means....write expressions and make them conditional.....
then
when ever your selected the APAC region..it is going to display remaining 2 regions(EU,NA) of sales.
like fallows:

and
if you selected on EU region..it is going to display the remaining region sales(APAC,NA).

and
if you selected on NA region..it is going to display the remaining region sales(APAC,EU).

and
do the same process for all your data,means....
apply the same process on your countries filed and also on states filed like on regions filed.
I think it will helps you,
Thanq.
- Mark as New
- Bookmark
- Subscribe
- Mute
- Subscribe to RSS Feed
- Permalink
- Report Inappropriate Content
Hi Chaitanya,
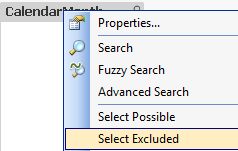
Have you tried select excluded value from list box?

- Mark as New
- Bookmark
- Subscribe
- Mute
- Subscribe to RSS Feed
- Permalink
- Report Inappropriate Content
Kalayani, That is vast lengthy to track those. What if values has 100+.
Do mean this?
Sum({<Country = {'*'}-{'$(=GetFieldSelections(Country))'}>} Sales)
In your expression try like below instead of 3 expressions
Sum({<Region = {'*'}-{'$(=GetFieldSelections(Region))'}>} [Final Price])
- Mark as New
- Bookmark
- Subscribe
- Mute
- Subscribe to RSS Feed
- Permalink
- Report Inappropriate Content
Yes anil.....that is very lengthy...,
and
from your post i got simple expression,
Thanq.
- Mark as New
- Bookmark
- Subscribe
- Mute
- Subscribe to RSS Feed
- Permalink
- Report Inappropriate Content
assume you have two list boxes. right click on listbox1 and click on select
excluded. on the listbox2 do u required selection. so that value agianst
your selection wil be displayed in list box1
- Mark as New
- Bookmark
- Subscribe
- Mute
- Subscribe to RSS Feed
- Permalink
- Report Inappropriate Content
May be like this:
=Count({<Country = e(Country), State = e(State), Region = e(Region)>} Country)