Unlock a world of possibilities! Login now and discover the exclusive benefits awaiting you.
- Qlik Community
- :
- All Forums
- :
- QlikView App Dev
- :
- Re: How to display two colors in barchart
- Subscribe to RSS Feed
- Mark Topic as New
- Mark Topic as Read
- Float this Topic for Current User
- Bookmark
- Subscribe
- Mute
- Printer Friendly Page
- Mark as New
- Bookmark
- Subscribe
- Mute
- Subscribe to RSS Feed
- Permalink
- Report Inappropriate Content
How to display two colors in barchart
Hi All,
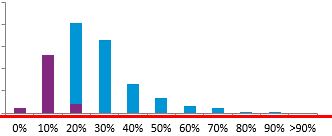
I want display batem 25% in Purple color remaining Blue color.
please send me sample qvw.
Thanks
sekhar.
- Mark as New
- Bookmark
- Subscribe
- Mute
- Subscribe to RSS Feed
- Permalink
- Report Inappropriate Content
Hi Michael,
The first 25% Purple color the remaining Blue color
Like that Michael.
Thanks
SEKHAR.
- Mark as New
- Bookmark
- Subscribe
- Mute
- Subscribe to RSS Feed
- Permalink
- Report Inappropriate Content
Hi Robert,
The first 25% Purple color the remaining Blue color

Like that Robert.
Thanks
SEKHAR.
- Mark as New
- Bookmark
- Subscribe
- Mute
- Subscribe to RSS Feed
- Permalink
- Report Inappropriate Content
Something like this?

Script:
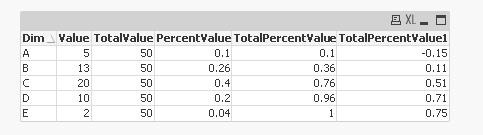
Table:
LOAD * Inline [
Dim, Value
A, 5
B, 13
C, 20
D, 10
E, 2
];
Join(Table)
LOAD Sum(Value) as TotalValue
Resident Table;
FinalTable:
LOAD Dim,
Value,
TotalValue,
Value/TotalValue as PercentValue
Resident Table;
FinalTable1:
LOAD *,
TotalPercentValue - 0.25 as TotalPercentValue1;
LOAD *,
PercentValue + Alt(Peek('TotalPercentValue'), 0) as TotalPercentValue
Resident FinalTable
Order By Dim;
DROP Table Table, FinalTable;
All Fields of FinalTable1 in a table box object:
Bar Chart Dimension: Dim
Bar Chart Expressions:
1) =If(TotalPercentValue1 < 0, PercentValue, If(TotalPercentValue1 = Min({<TotalPercentValue1 = {'>0'}>} TOTAL TotalPercentValue1), PercentValue - TotalPercentValue1))
2) =If(TotalPercentValue1 = Min({<TotalPercentValue1 = {'>0'}>} TOTAL TotalPercentValue1), TotalPercentValue1, If(TotalPercentValue1 > 0, PercentValue))
Attaching the QVW for reference.
HTH
Best,
Sunny
- Mark as New
- Bookmark
- Subscribe
- Mute
- Subscribe to RSS Feed
- Permalink
- Report Inappropriate Content
Hi.
Can you send the sample database (excel or something). I couldn't get 25% of what
(plz send if this question is still not solved)
- Mark as New
- Bookmark
- Subscribe
- Mute
- Subscribe to RSS Feed
- Permalink
- Report Inappropriate Content
Hi Michael,
I guess kula sekhar is expecting X- axis first 25% is Purple colour and rest 75% in Blue colour.
- Mark as New
- Bookmark
- Subscribe
- Mute
- Subscribe to RSS Feed
- Permalink
- Report Inappropriate Content
Am i correct Kula Sekhar???
- Mark as New
- Bookmark
- Subscribe
- Mute
- Subscribe to RSS Feed
- Permalink
- Report Inappropriate Content
The bars are depicting some values, right? So the requirement is to show first 25% of total value( may be shown under first 1,2,2.5..bars) in purple color and rest of the total values( depicted under rest of the bars..) in blue color.
- Mark as New
- Bookmark
- Subscribe
- Mute
- Subscribe to RSS Feed
- Permalink
- Report Inappropriate Content
Great! This is working perfectly! I think change in bcgrnd color in expression may reflect the purple and blue color, cannot see the qvw as I have PE.
Would you mind explaining one thing, may be silly one, how come a single row'TotalValue' joined to Dim of 'TABLE' without having any matching key. I think I am missing something basic here. 
Join(Table)
LOAD Sum(Value) as TotalValue
Resident Table;
Thanks again, your posts r helping a lot. Take care,
- Mark as New
- Bookmark
- Subscribe
- Mute
- Subscribe to RSS Feed
- Permalink
- Report Inappropriate Content
Hey Digvijay I am glad you are getting to learn from me  . And trust me no questions are silly. To answer your question, when there are no matching keys between the table you are joining from and the table you join to then you end up forming a Cartesian product. But for this particular case where TotalValue is just a single value it is added as a new column with one value for each of the rows.
Example:
Before Join
Dim, Value
A, 10
B, 20
C, 30
TotalValue
60
AfterJoin
Dim, Value, TotalValue
A, 10, 60
B, 20, 60
C, 30, 60
I hope the above example will clarify things.
Best,
Sunny
- Mark as New
- Bookmark
- Subscribe
- Mute
- Subscribe to RSS Feed
- Permalink
- Report Inappropriate Content
I'm maybe a little late...
See attached solution which is purely front-end, nothing in the script to support it. The advantage is that it is dynamic, and the 25% is defined in a variable, so it can be changed easily to any other %.
Still it doesn't work properly in some conditions, e.g. if the first value is greater than the 25%. I'll maybe get back to clean it up, or maybe somebody else will do it before...