Unlock a world of possibilities! Login now and discover the exclusive benefits awaiting you.
- Qlik Community
- :
- All Forums
- :
- QlikView App Dev
- :
- How to divide the quantity of store by its consump...
- Subscribe to RSS Feed
- Mark Topic as New
- Mark Topic as Read
- Float this Topic for Current User
- Bookmark
- Subscribe
- Mute
- Printer Friendly Page
- Mark as New
- Bookmark
- Subscribe
- Mute
- Subscribe to RSS Feed
- Permalink
- Report Inappropriate Content
How to divide the quantity of store by its consumption during last three months
Hi, everybody!
Please, help me!
I need to divide the quantity of store by its consumption during last three months.
I'm a very beginer, so I bag your pardon for this way of expressing my idea:
sum([Quantity])/(sum({<MonthName=MonthOfConsumption-1>} [Consumption]) + (sum({<MonthName=MonthOfConsumption-2>} [Consumption]) + (sum({<MonthName=MonthOfConsumption-3>} [Consumption])
Thank you VERY MUCH!
- « Previous Replies
- Next Replies »
Accepted Solutions
- Mark as New
- Bookmark
- Subscribe
- Mute
- Subscribe to RSS Feed
- Permalink
- Report Inappropriate Content
Добрый день, Алексей.
Результат получился несмещенный из-за преобразований форматов Date->Int, а в обратную сторону уже не очень красиво получается. В приложении Ваш файл, с добавленным календарем.
У меня получилось 2 типа графика:
1. Выбираешь 1 дату для МесяцРасхода - получаешь со смещением (как советовал Dariusz)
2. Выбираешь любой месяц и любое количество, которое нужно и получаешь график по Расходу.
Выбирайте, что Вам/Заказчику удобнее.
Также используя выражения $, $1, $2 в Set Analysis можете получать таблицы с динамически подставляемыми датами, т.е. щелкаете по фильтрам сен, потом авг, потом май к примеру, получите суммы за каждый из месяцев.
Надеюсь это поможет.
Удачи.
Андрей
- Mark as New
- Bookmark
- Subscribe
- Mute
- Subscribe to RSS Feed
- Permalink
- Report Inappropriate Content
Hi, Alexei
What problem you faced on?
The logic of your expression is quite right, there are only syntax mistakes
sum([Quantity])/
((sum({$<MonthName={$(=MonthOfConsumption-1)}>} [Consumption]) +
(sum({$<MonthName={$(=MonthOfConsumption-2)}>} [Consumption]) +
(sum({$<MonthName={$(=MonthOfConsumption-3)}>} [Consumption])
)
Hope this helps.
Regards,
Andrei
- Mark as New
- Bookmark
- Subscribe
- Mute
- Subscribe to RSS Feed
- Permalink
- Report Inappropriate Content
Alexei,
typpical data model for this will be something like this:
store, date, consumption
store1, 2014-01-01, 10
store1,2014-01-02, 12
store2, 2014-01-01, 34
......
In this model :
a) expression:
count(distinct store)
will give you stores number
b) expression
sum({<date={">='2014-01-01<=2014-03-31"}>}consumption)
will give you consumption from 1-01 to 31-03.
So, you final expression may be something like this:
count(distinct store)/sum({<date={">='2014-01-01<=2014-03-31"}>}consumption)
There still is the question and it deppends on you particular needs, how to get those dates for set analysis.
regards
Darek
- Mark as New
- Bookmark
- Subscribe
- Mute
- Subscribe to RSS Feed
- Permalink
- Report Inappropriate Content
Андрей, спасибо за Вашу помощь!
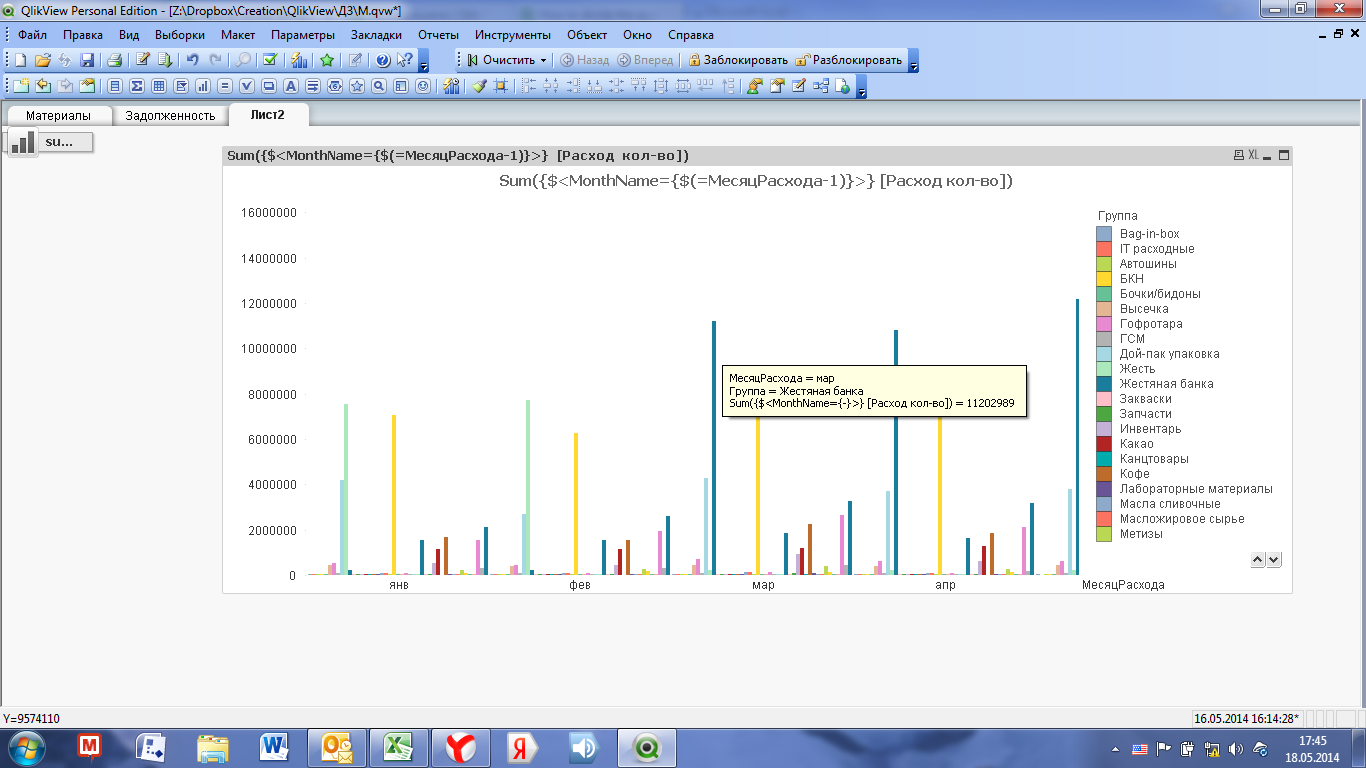
Я попробовал вставить в диаграмму часть предложенной Вами формулы. Ожидал, что получу расход материала, сдвинутый на один месяц. А получил расход материала без сдвига.
Где я ошибся?
Еще раз спасибо!
- Mark as New
- Bookmark
- Subscribe
- Mute
- Subscribe to RSS Feed
- Permalink
- Report Inappropriate Content
Dariusz, thank you!

Unfortunately, it doesn't work...
Maybe, I misunderstood you?
- Mark as New
- Bookmark
- Subscribe
- Mute
- Subscribe to RSS Feed
- Permalink
- Report Inappropriate Content
Alexiej,
do you have field named: MonthName?
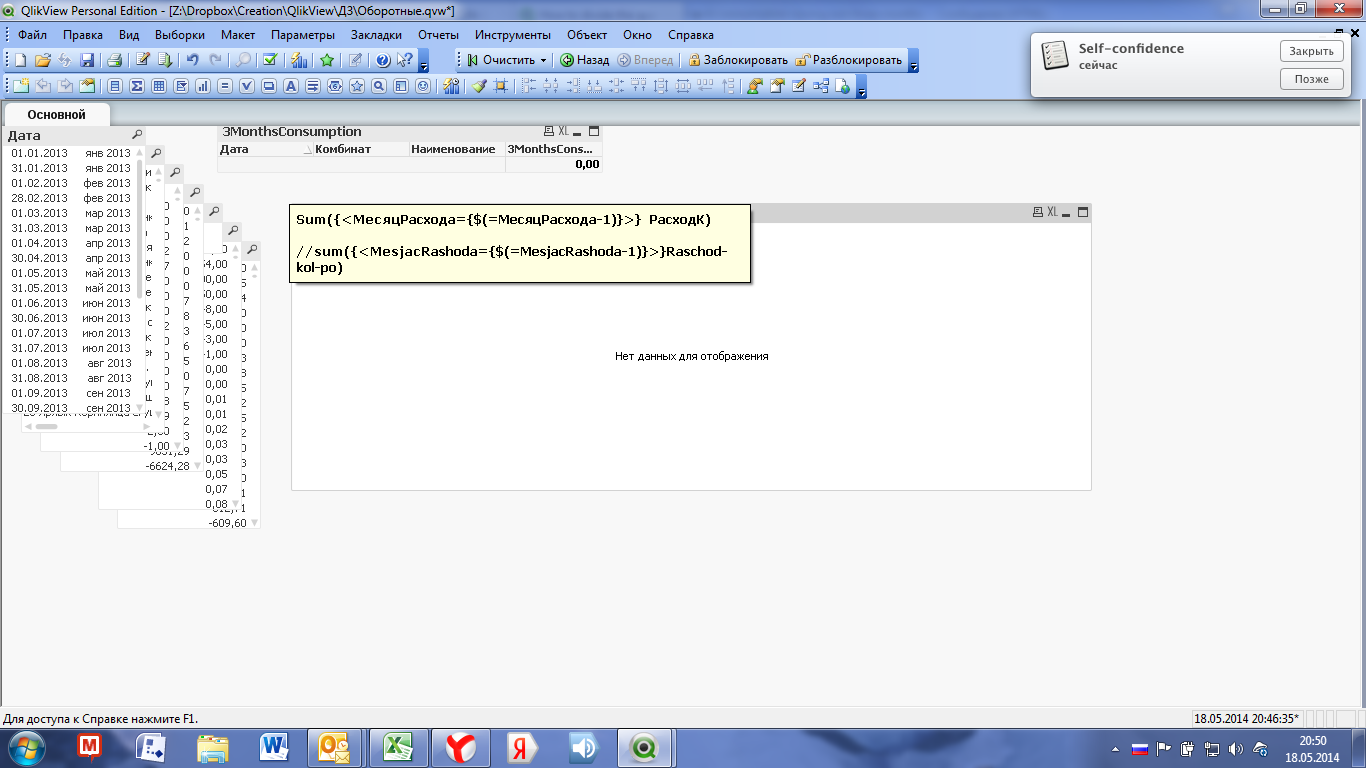
I think you need:
sum({<MesjacRashoda={$(=MesjacRashoda-1)}>}Raschod-kol-po)
of course pun your field names as they are in application.
regads
Darek
- Mark as New
- Bookmark
- Subscribe
- Mute
- Subscribe to RSS Feed
- Permalink
- Report Inappropriate Content
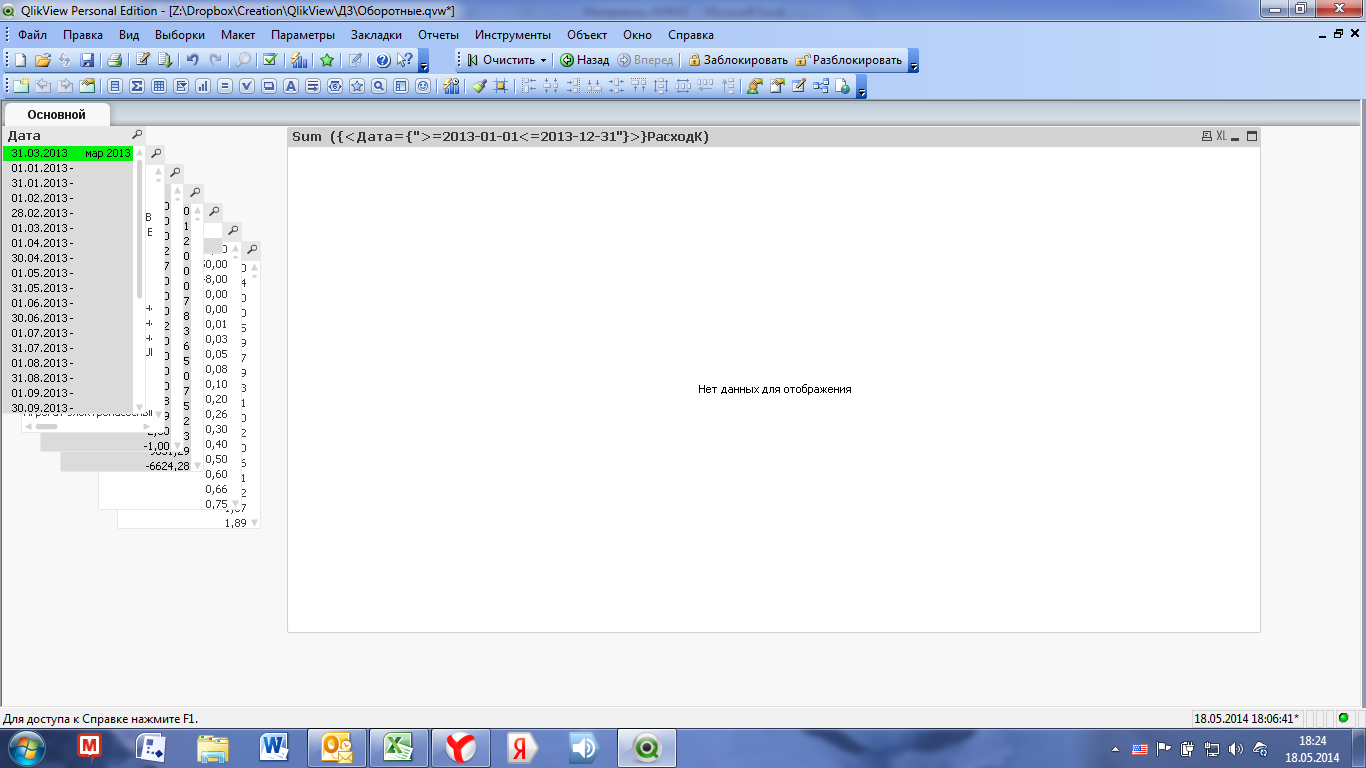
Unfortunately, this metod doesn't work too...
Maybe I should try to do this in table?
Where am I mistaken?
Thank you!
- Mark as New
- Bookmark
- Subscribe
- Mute
- Subscribe to RSS Feed
- Permalink
- Report Inappropriate Content
Maybe you may attach your application with sample data?
- Mark as New
- Bookmark
- Subscribe
- Mute
- Subscribe to RSS Feed
- Permalink
- Report Inappropriate Content
go to staraight table and put simple $(=MiesjacRashoda) as expression. Look what result you get.
- Mark as New
- Bookmark
- Subscribe
- Mute
- Subscribe to RSS Feed
- Permalink
- Report Inappropriate Content
Dariusz, I don't know why I can't succeed.
Of course I can attach the application.
And thank you very much! You're spending so much time for me!
- « Previous Replies
- Next Replies »