Unlock a world of possibilities! Login now and discover the exclusive benefits awaiting you.
- Qlik Community
- :
- All Forums
- :
- QlikView App Dev
- :
- Re: How to do Simple Forecast of an Accumulated Lo...
- Subscribe to RSS Feed
- Mark Topic as New
- Mark Topic as Read
- Float this Topic for Current User
- Bookmark
- Subscribe
- Mute
- Printer Friendly Page
- Mark as New
- Bookmark
- Subscribe
- Mute
- Subscribe to RSS Feed
- Permalink
- Report Inappropriate Content
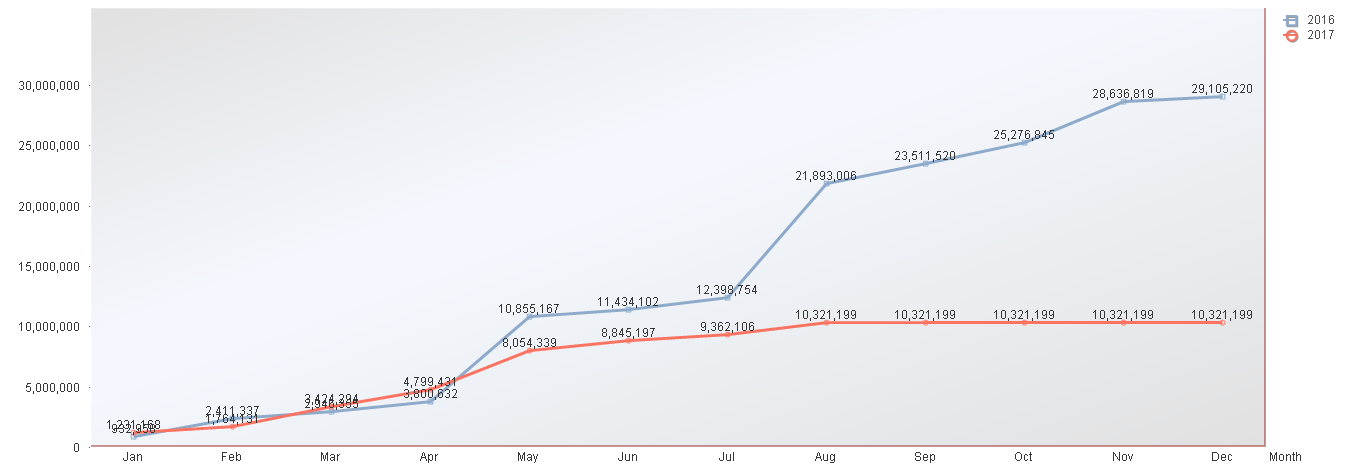
How to do Simple Forecast of an Accumulated Loss Amount (Charts & Value)
Hi,
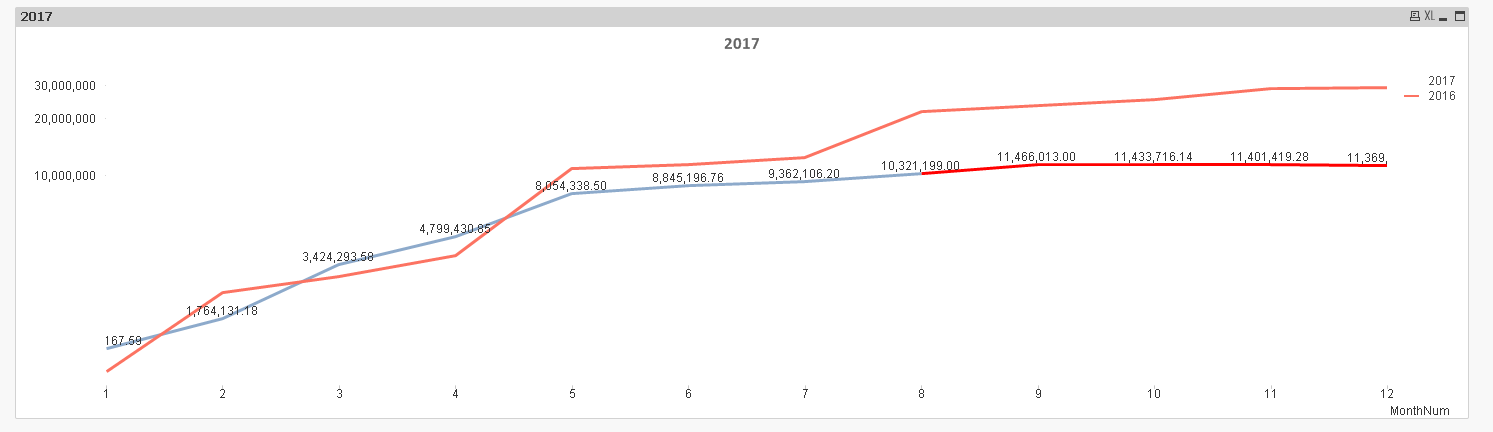
Can anyone help me on how to provide simple forecast for the loss amount below? If you notice in Aug 2017, the accumulative amount is similar until the rest of the year since there is no data. I would like to replace the data with accumulation of the forecast value. I would also like the value to be reflected in a table. If the answer is in script, please provide the full script since I am still new with the language.
Also, appreciate if you can explain the logic behind the forecast as well. PFA the file for your reference. Thanks.
- « Previous Replies
-
- 1
- 2
- Next Replies »
Accepted Solutions
- Mark as New
- Bookmark
- Subscribe
- Mute
- Subscribe to RSS Feed
- Permalink
- Report Inappropriate Content
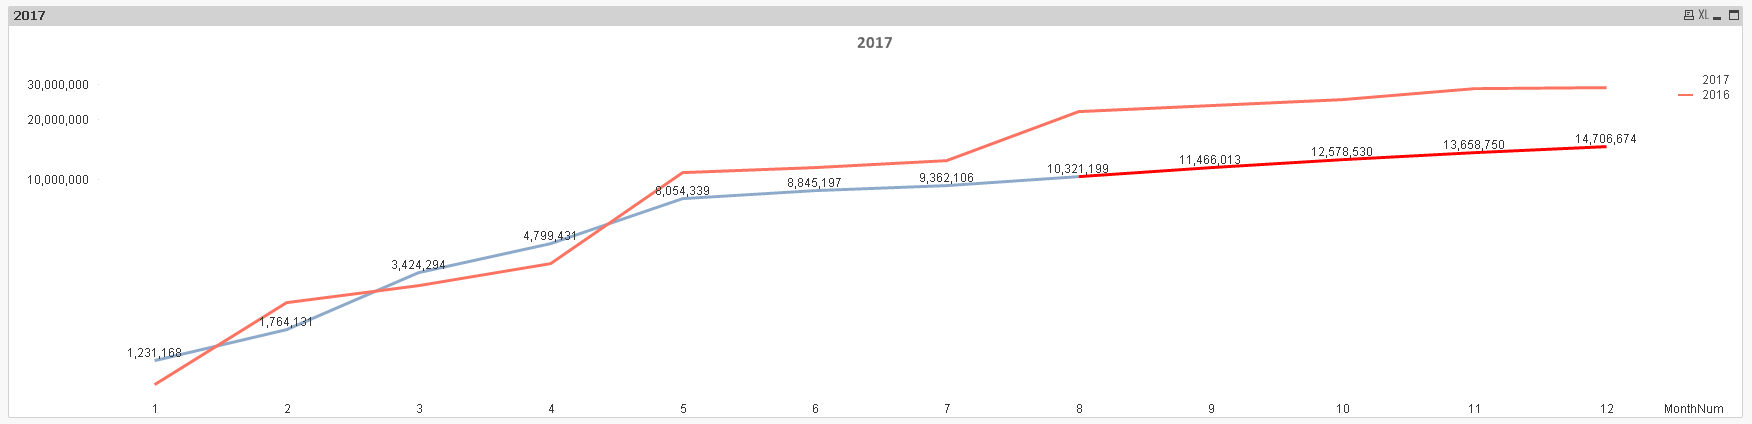
Actually this might be the best
RangeSum(Above(if(sum({<Year={2017}>}[Grand total]),sum({<Year={2017}>}[Grand total])
,linest_m(total aggr(if(sum({<Year={2017}>}[Grand total]),sum({<Year={2017}>}[Grand total])),MonthNum),MonthNum)*MonthNum
+linest_b(total aggr(if(sum({<Year={2017}>}[Grand total]),sum({<Year={2017}>}[Grand total])),MonthNum),MonthNum)), 0, RowNo()))
- Mark as New
- Bookmark
- Subscribe
- Mute
- Subscribe to RSS Feed
- Permalink
- Report Inappropriate Content
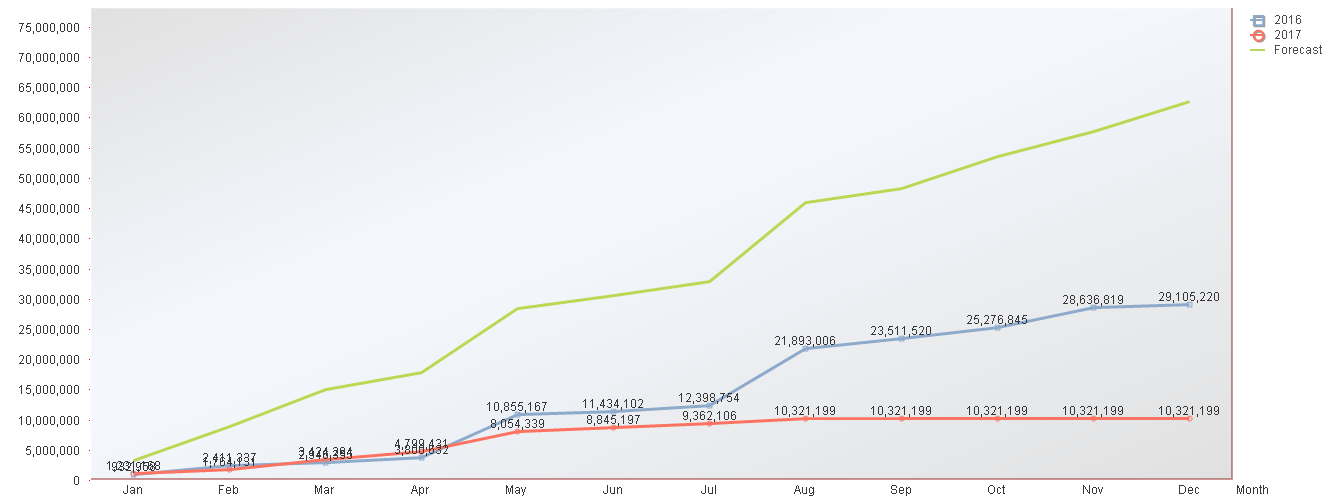
Have a look here: Forecasting in Qlikview
- Mark as New
- Bookmark
- Subscribe
- Mute
- Subscribe to RSS Feed
- Permalink
- Report Inappropriate Content
Hi Tresesco,
When I use the method, it will create a new line for forecast, not extension of 2017 data. Btw, how to attach the files? I cannoy attach qlikview file I created.
- Mark as New
- Bookmark
- Subscribe
- Mute
- Subscribe to RSS Feed
- Permalink
- Report Inappropriate Content
If you reply from the discussion thread (not from inbox), you should get 'Use advanced editor' at the right-top after clicking the reply option. Then, there at the right-bottom we get to attach your file.
Try to create numeric/dual month values using
Month(Date) as Month
Or,
Month(Date#(Year&Month, 'YYYYMMM')) as Month
Or,
Num(Month(Date#(Year&Month, 'YYYYMMM'))) as MonthNum
Then try/share the qvw.
- Mark as New
- Bookmark
- Subscribe
- Mute
- Subscribe to RSS Feed
- Permalink
- Report Inappropriate Content
My date has been separated. I have three columns in my data, Month, Year and Grand Total. PFA
- Mark as New
- Bookmark
- Subscribe
- Mute
- Subscribe to RSS Feed
- Permalink
- Report Inappropriate Content
PFA.
As suggested above, create a numeric month field and then use expression something like:
if(sum({<Year={2017}>}[Grand total]),RangeSum(Above(sum({<Year={2017}>}[Grand total]),0,RowNo(TOTAL)))
,linest_m(total aggr(if(sum({<Year={2017}>}[Grand total]),sum({<Year={2017}>}[Grand total])),MonthNum),MonthNum)*MonthNum
+linest_b(total aggr(if(sum({<Year={2017}>}[Grand total]),sum({<Year={2017}>}[Grand total])),MonthNum),MonthNum))
- Mark as New
- Bookmark
- Subscribe
- Mute
- Subscribe to RSS Feed
- Permalink
- Report Inappropriate Content
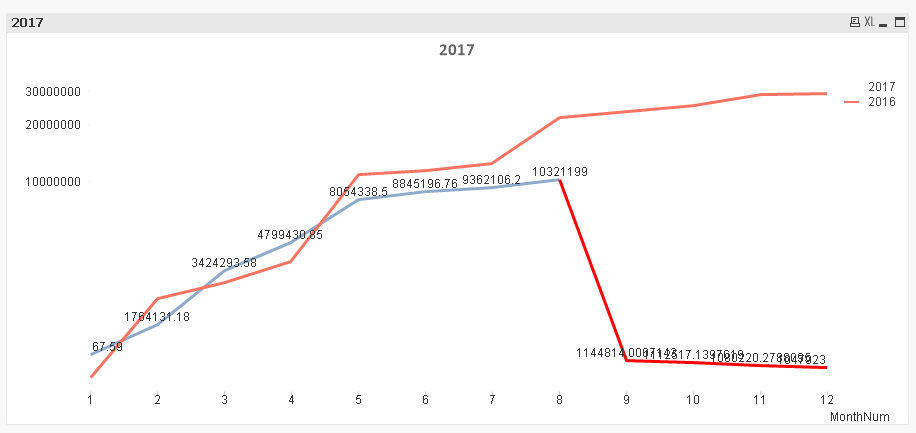
Or may be this
if(sum({<Year={2017}>}[Grand total]),RangeSum(Above(sum({<Year={2017}>}[Grand total]),0,RowNo(TOTAL)))
,Sum(TOTAL {<Year={2017}>}[Grand total]) + linest_m(total aggr(if(sum({<Year={2017}>}[Grand total]),sum({<Year={2017}>}[Grand total])),MonthNum),MonthNum)*MonthNum
+linest_b(total aggr(if(sum({<Year={2017}>}[Grand total]),sum({<Year={2017}>}[Grand total])),MonthNum),MonthNum))
- Mark as New
- Bookmark
- Subscribe
- Mute
- Subscribe to RSS Feed
- Permalink
- Report Inappropriate Content
Actually this might be the best
RangeSum(Above(if(sum({<Year={2017}>}[Grand total]),sum({<Year={2017}>}[Grand total])
,linest_m(total aggr(if(sum({<Year={2017}>}[Grand total]),sum({<Year={2017}>}[Grand total])),MonthNum),MonthNum)*MonthNum
+linest_b(total aggr(if(sum({<Year={2017}>}[Grand total]),sum({<Year={2017}>}[Grand total])),MonthNum),MonthNum)), 0, RowNo()))
- Mark as New
- Bookmark
- Subscribe
- Mute
- Subscribe to RSS Feed
- Permalink
- Report Inappropriate Content
Thank you so much, Sunny! Btw, how do I customize the colour of the forecast value? Do I need a code for that? Also, any chance I can show month as text in the x-axis instead of number?
- Mark as New
- Bookmark
- Subscribe
- Mute
- Subscribe to RSS Feed
- Permalink
- Report Inappropriate Content
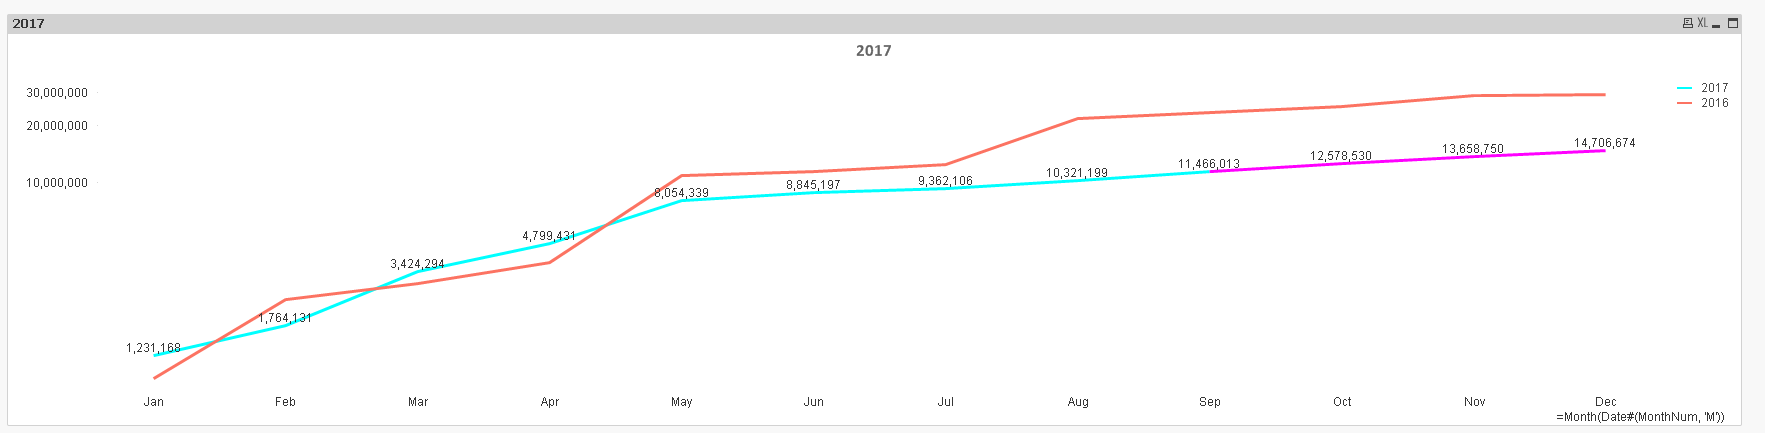
I used this to convert MonthNum to a Month, but you can do this in the script also where you might have already created a Month field and use that as your dimension
=Month(Date#(MonthNum, 'M'))
For color, I used this as a background color expression
if(sum({<Year={2017}>}[Grand total]),LightCyan(), LightMagenta())
- « Previous Replies
-
- 1
- 2
- Next Replies »