Unlock a world of possibilities! Login now and discover the exclusive benefits awaiting you.
- Qlik Community
- :
- All Forums
- :
- QlikView App Dev
- :
- Re: How to easily create YoY Comparison in Chart
Options
- Subscribe to RSS Feed
- Mark Topic as New
- Mark Topic as Read
- Float this Topic for Current User
- Bookmark
- Subscribe
- Mute
- Printer Friendly Page
Turn on suggestions
Auto-suggest helps you quickly narrow down your search results by suggesting possible matches as you type.
Showing results for
Not applicable
2015-03-05
02:39 PM
- Mark as New
- Bookmark
- Subscribe
- Mute
- Subscribe to RSS Feed
- Permalink
- Report Inappropriate Content
How to easily create YoY Comparison in Chart
I have some data where I would like to have a year over year comparison. My data has a Fiscal Year Quarter field with values of 2014-Q1 to 2015-Q4. Is there a simple way using expressions to create a YoY comparison chart like the image below?
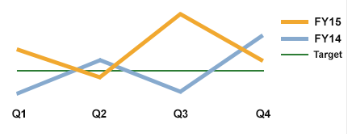
Thanks in advance!
855 Views
1 Solution
Accepted Solutions
MVP
2015-03-05
02:48 PM
- Mark as New
- Bookmark
- Subscribe
- Mute
- Subscribe to RSS Feed
- Permalink
- Report Inappropriate Content
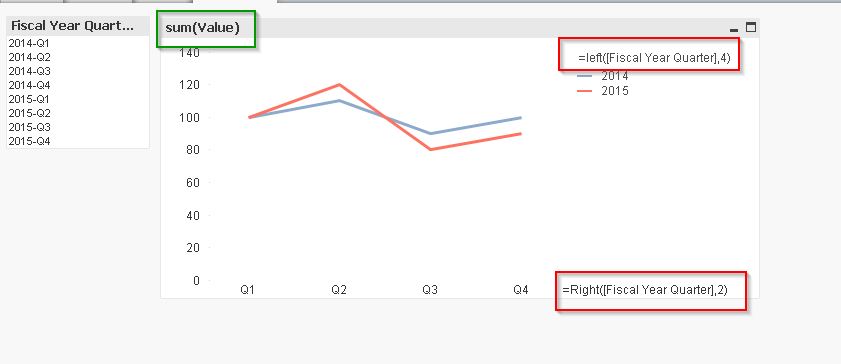
using 2 calculated dimensions (red rectangle)
and 1 expression (green)
2 Replies
MVP
2015-03-05
02:48 PM
- Mark as New
- Bookmark
- Subscribe
- Mute
- Subscribe to RSS Feed
- Permalink
- Report Inappropriate Content
using 2 calculated dimensions (red rectangle)
and 1 expression (green)
Not applicable
2015-03-05
04:19 PM
Author
- Mark as New
- Bookmark
- Subscribe
- Mute
- Subscribe to RSS Feed
- Permalink
- Report Inappropriate Content
Perfect! This is exactly what I need. Thanks Massimo!
661 Views