Unlock a world of possibilities! Login now and discover the exclusive benefits awaiting you.
- Qlik Community
- :
- All Forums
- :
- QlikView App Dev
- :
- Re: How to emphasize the lowest/highest value in a...
- Subscribe to RSS Feed
- Mark Topic as New
- Mark Topic as Read
- Float this Topic for Current User
- Bookmark
- Subscribe
- Mute
- Printer Friendly Page
- Mark as New
- Bookmark
- Subscribe
- Mute
- Subscribe to RSS Feed
- Permalink
- Report Inappropriate Content
How to emphasize the lowest/highest value in a graph
Dear all,
I've a graph, a linear graph, which represents a sort of performance monitor.
Is it possible to underline , emphasize, the lowest value (or high) ?
Thanks in advance
Stefan
- Tags:
- new_to_qlikview
Accepted Solutions
- Mark as New
- Bookmark
- Subscribe
- Mute
- Subscribe to RSS Feed
- Permalink
- Report Inappropriate Content
What I typically do is use the rank() function with a combo chart.
First I write an expression for the line I am graphing:
sum(Expression1)
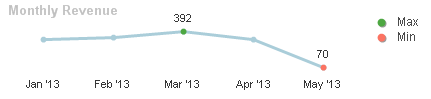
Then I add separate expressions for the min and the max that are set to be symbols instead of lines. The expression for the max:
if(rank(sum(Expression1))=1,sum(Expression1))
The min would be the inverse of that expression:
if(rank(-sum(Expression1))=1,sum(Expression1))
Finally, I use the Background Color settings available on the expression dropdown to set the min and max to the colors I want. The result:
- Mark as New
- Bookmark
- Subscribe
- Mute
- Subscribe to RSS Feed
- Permalink
- Report Inappropriate Content
What I typically do is use the rank() function with a combo chart.
First I write an expression for the line I am graphing:
sum(Expression1)
Then I add separate expressions for the min and the max that are set to be symbols instead of lines. The expression for the max:
if(rank(sum(Expression1))=1,sum(Expression1))
The min would be the inverse of that expression:
if(rank(-sum(Expression1))=1,sum(Expression1))
Finally, I use the Background Color settings available on the expression dropdown to set the min and max to the colors I want. The result:
- Mark as New
- Bookmark
- Subscribe
- Mute
- Subscribe to RSS Feed
- Permalink
- Report Inappropriate Content
Hi Speros,
you are the best !!
THANKS!!
