Unlock a world of possibilities! Login now and discover the exclusive benefits awaiting you.
- Qlik Community
- :
- All Forums
- :
- QlikView App Dev
- :
- Re: How to exclude certain records from appearing ...
- Subscribe to RSS Feed
- Mark Topic as New
- Mark Topic as Read
- Float this Topic for Current User
- Bookmark
- Subscribe
- Mute
- Printer Friendly Page
- Mark as New
- Bookmark
- Subscribe
- Mute
- Subscribe to RSS Feed
- Permalink
- Report Inappropriate Content
How to exclude certain records from appearing in the straight table
Hi,
I've an aging records table obtained using calculations from Set analysis to get expected output
I've included data files and applications file here as well.
Question1)
On the Aging worksheet I need to exclude records where OSN value is OSN8. They should not be part of detail or the count.
expected count 120, expected result file attached.
Question 2)
Count is not working when all values other than OSN8 are selected from filter pane for OSN.
Detail table should not show other records. (as seen in second image # 2)
Image # 1
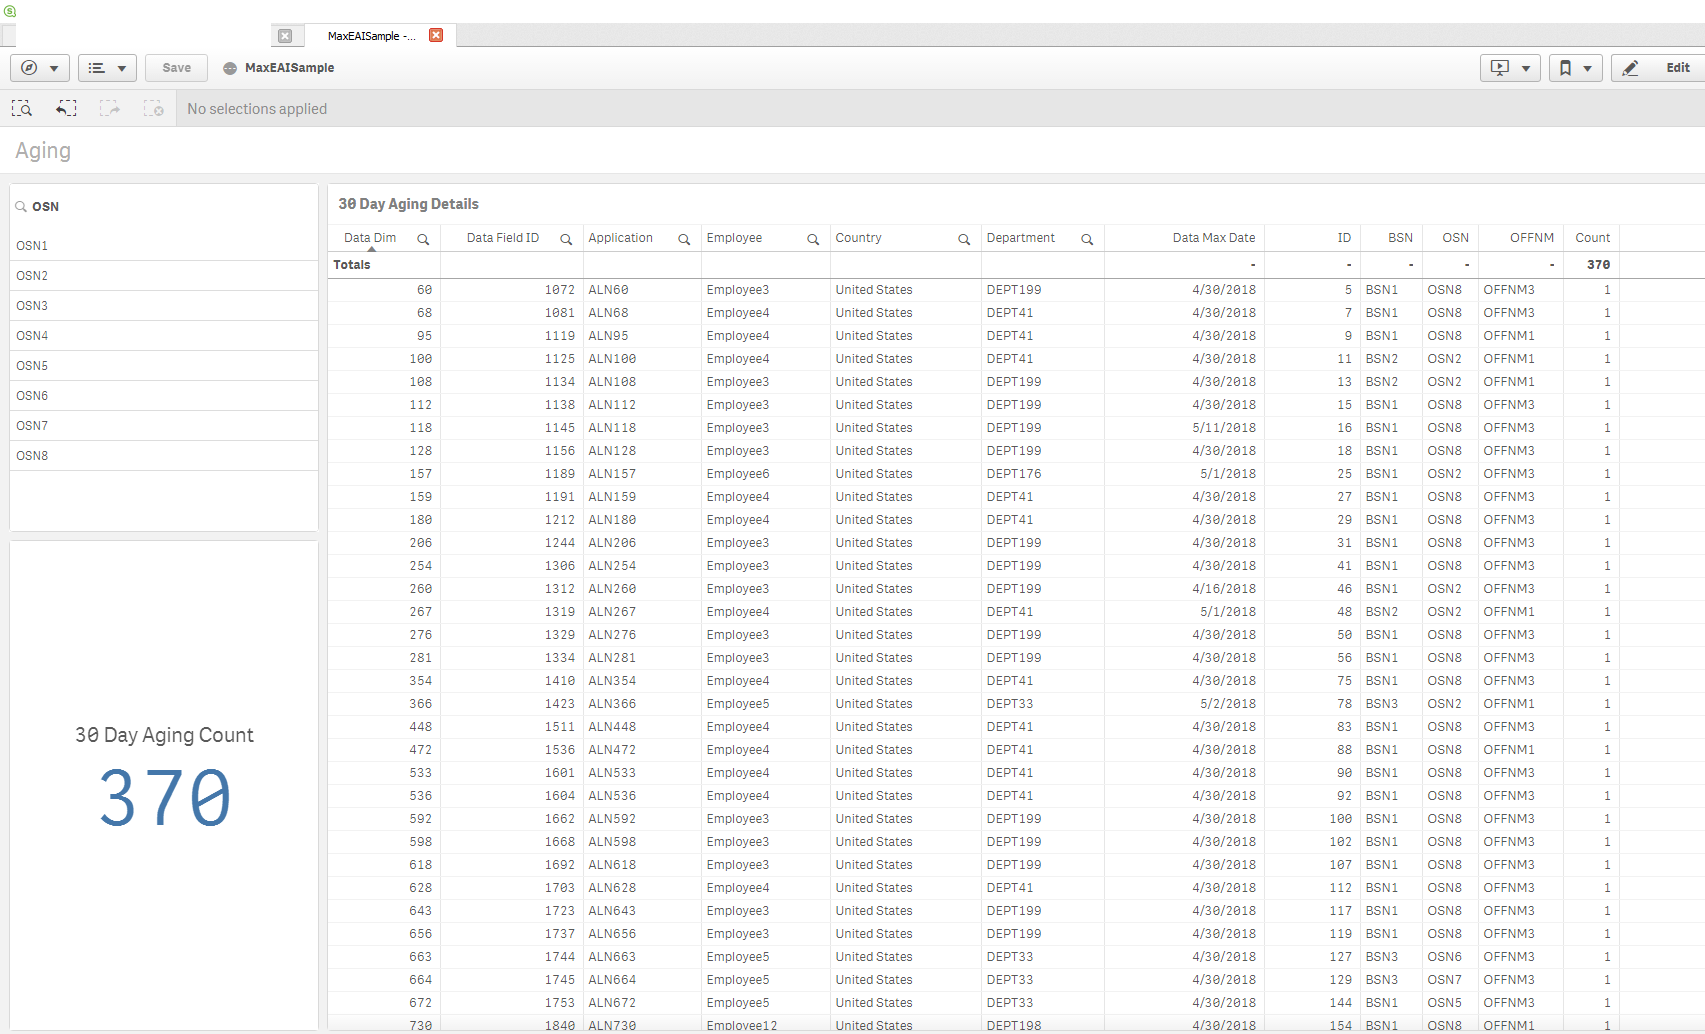
Image # 2

- « Previous Replies
-
- 1
- 2
- Next Replies »
Accepted Solutions
- Mark as New
- Bookmark
- Subscribe
- Mute
- Subscribe to RSS Feed
- Permalink
- Report Inappropriate Content
Try this
=Sum(Aggr(If(Max(TOTAL <DIM_FLD1_Id> [Data Date]) = [Data Date], 1, 0), DIM_FLD1_Id, [Data Date]))

- Mark as New
- Bookmark
- Subscribe
- Mute
- Subscribe to RSS Feed
- Permalink
- Report Inappropriate Content
Question1)
On the Aging worksheet I need to exclude records where OSN value is OSN8. They should not be part of detail or the count.
expected count 120, expected result file attached.
I got 119 using this as the calculated dimension
=Aggr(If(Max([Data Date]) < Today() - 30 and FirstSortedValue(OSN, -[Data Date]) <> 'OSN8', DIM_FLD1_Id), DIM_FLD1_Id)
- Mark as New
- Bookmark
- Subscribe
- Mute
- Subscribe to RSS Feed
- Permalink
- Report Inappropriate Content
I guess you are also getting 119, you counted the data label row as well 
- Mark as New
- Bookmark
- Subscribe
- Mute
- Subscribe to RSS Feed
- Permalink
- Report Inappropriate Content
Question 2)
Count is not working when all values other than OSN8 are selected from filter pane for OSN.
Detail table should not show other records. (as seen in second image # 2)
This is because as soon as you select OSN, the Date Max Date changes causing the OSNs, BSNs to change as well... you might need to ignore selection in OSN or BSN if you are hoping to make selections there so that the values don't change in the chart and in the KPI object
- Mark as New
- Bookmark
- Subscribe
- Mute
- Subscribe to RSS Feed
- Permalink
- Report Inappropriate Content
Hi Sunny,
What am I doing wrong for KPI
Following does not change count
=Count(DISTINCT {<DIM_FLD1_Id = {"=Max([Data Date]) <= Today() - 30"}, OSN = {"=FirstSortedValue(OSN, -[Data Date]) <> 'OSN8'"}>} DIM_FLD1_Id)
Following gives 9
=Count(DISTINCT {<DIM_FLD1_Id = {"=Max([Data Date]) <= Today() - 30"}, OSN = {"=FirstSortedValue(OSN, -[Data Date]) <> MaxString('OSN8')"}>} DIM_FLD1_Id)
- Mark as New
- Bookmark
- Subscribe
- Mute
- Subscribe to RSS Feed
- Permalink
- Report Inappropriate Content
For KPI
=Count(DISTINCT {<DIM_FLD1_Id = {"=Max({<OSN, BSN>}[Data Date]) < Today() - 30 and FirstSortedValue(OSN, -[Data Date]) <> 'OSN8'"}>} DIM_FLD1_Id)
- Mark as New
- Bookmark
- Subscribe
- Mute
- Subscribe to RSS Feed
- Permalink
- Report Inappropriate Content
it is lol on my side for silly mistake....
Not sure what I typed wrong initially. You are right on solution. Let me check other items.
- Mark as New
- Bookmark
- Subscribe
- Mute
- Subscribe to RSS Feed
- Permalink
- Report Inappropriate Content
Hi Sunny,
Can you please explain how to do it for the question 2. It seems that it is similar to problem I'm running into larger count for the Stacked bar chart having dimension OFFNM and BSN as dimensions and measure formula as
Count(DISTINCT {<DIM_FLD1_Id = {"=Max([Data Date])"}>} DIM_FLD1_Id)
My result has following records that shouldn't be there for BSN2
DIM_FLD1_Id
366
1342
1556
1640
2029
2860
2929
2954
2976
3067
3370
3613
5240
6057
6902
7494
- Mark as New
- Bookmark
- Subscribe
- Mute
- Subscribe to RSS Feed
- Permalink
- Report Inappropriate Content
Would you be able to update the sample and show the issue?
- Mark as New
- Bookmark
- Subscribe
- Mute
- Subscribe to RSS Feed
- Permalink
- Report Inappropriate Content
Hi Sunny,
Please find attached sample app. All three (bar and pivot) charts should have count of 640 corresponding to data in the straight table.
BR,
Vijay
- « Previous Replies
-
- 1
- 2
- Next Replies »