Unlock a world of possibilities! Login now and discover the exclusive benefits awaiting you.
- Qlik Community
- :
- All Forums
- :
- QlikView App Dev
- :
- Re: How to filter chart by a field value
- Subscribe to RSS Feed
- Mark Topic as New
- Mark Topic as Read
- Float this Topic for Current User
- Bookmark
- Subscribe
- Mute
- Printer Friendly Page
- Mark as New
- Bookmark
- Subscribe
- Mute
- Subscribe to RSS Feed
- Permalink
- Report Inappropriate Content
How to filter chart by a field value
Hi.
Im quite new to Qlikview, so please bear with me.
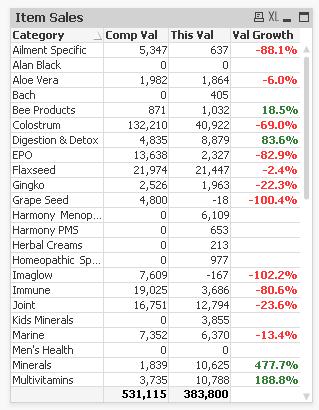
I have a chart of categories with comparison values from one year to the next. I've been asked to make 4 of these charts, one for each of our cost centers.
Im having trouble working out where to set the filter for each one.
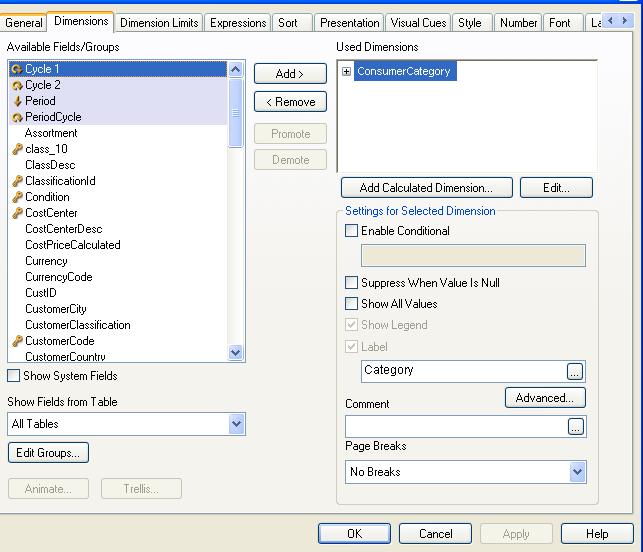
The comparison chart was created by an outside consultant, so I've just copied it and changed the dimensions to show what I want to show.
Examples of our CostCenter's codes are SINT, STOUR and SSI. What code would I use, and where would I put it to set each table to a specific cost center.
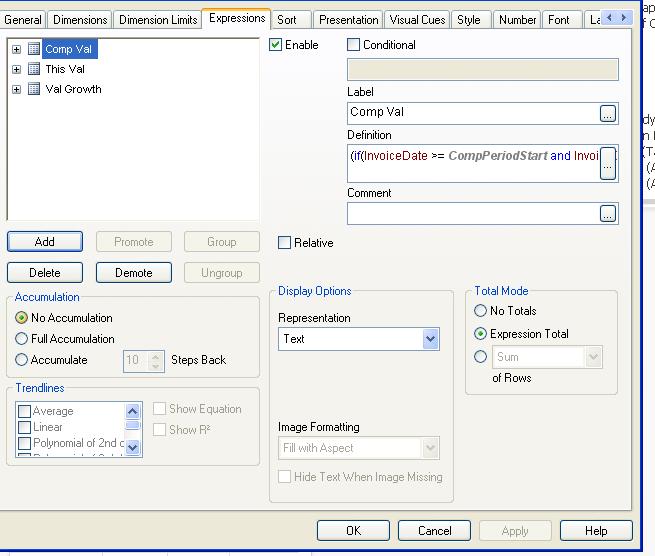
I have attached 3 pictures of how the chart looks, and how the dimensions and expressions are set up.
Thank you.
- Tags:
- new_to_qlikview
- « Previous Replies
-
- 1
- 2
- Next Replies »
- Mark as New
- Bookmark
- Subscribe
- Mute
- Subscribe to RSS Feed
- Permalink
- Report Inappropriate Content
You're welcome.
Glad to have helped you^^
- « Previous Replies
-
- 1
- 2
- Next Replies »