Unlock a world of possibilities! Login now and discover the exclusive benefits awaiting you.
- Qlik Community
- :
- All Forums
- :
- QlikView App Dev
- :
- Re: How to find distinct data points per person
- Subscribe to RSS Feed
- Mark Topic as New
- Mark Topic as Read
- Float this Topic for Current User
- Bookmark
- Subscribe
- Mute
- Printer Friendly Page
- Mark as New
- Bookmark
- Subscribe
- Mute
- Subscribe to RSS Feed
- Permalink
- Report Inappropriate Content
How to find distinct data points per person
Hi there,
I am looking for a way to list distinct data points on a user and then show it in groups after.
Example is a I have an email, name, zip code, and birthday for Bob. That would be 4 data points. We only have Susan's Name and Birthday so that's only 2 data points.
Then I could also do a sum of people with 2 data points and so on.
The data would be null in the fields if there isn't any collected yet for that person.
A table simplified like this for example:
| user | name | zipcode | birthday | |
| BobD | Bob Kelly | Bob@Kelly.com | 90210 | 12/12/2001 |
| Susan O | Susan Oleade | Susan@O.com | ||
| DaveC | Dave Clarke | 10001 |
- Mark as New
- Bookmark
- Subscribe
- Mute
- Subscribe to RSS Feed
- Permalink
- Report Inappropriate Content
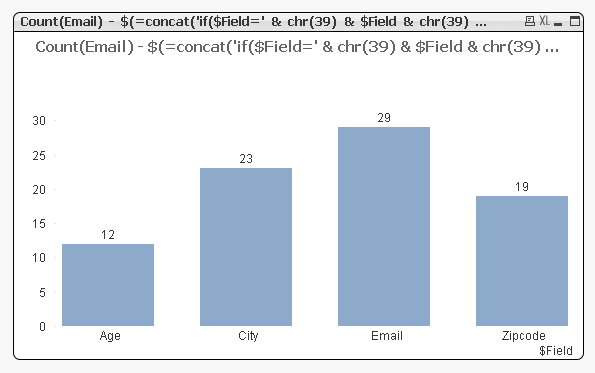
Ok I Imported data and gave a mockup bar chart on what I am trying to achieve.
I do like your Data Integrity chart. I will use that to see a high level of everything for this and other projects.
Thanks again!
- Mark as New
- Bookmark
- Subscribe
- Mute
- Subscribe to RSS Feed
- Permalink
- Report Inappropriate Content
Can you check the attached now
- Mark as New
- Bookmark
- Subscribe
- Mute
- Subscribe to RSS Feed
- Permalink
- Report Inappropriate Content
Ok that is it. Question. Using this will it show all fields? If I have 100 fields and only want to see the values of 6 of them. I haven't used $Field before. I am assuming that is what it is doing.
- Mark as New
- Bookmark
- Subscribe
- Mute
- Subscribe to RSS Feed
- Permalink
- Report Inappropriate Content
You can restrict fields from certain tables or by deciding what you wish to see. For instance I removed Email by using a calculated dimension:
=If(Not Match($Field, 'Email'), $Field)

- Mark as New
- Bookmark
- Subscribe
- Mute
- Subscribe to RSS Feed
- Permalink
- Report Inappropriate Content
For a more specific match, you can use:
If(Match($Field, 'FieldName1', 'FieldName2', 'FieldName3', 'FieldName4', 'FieldName5', 'FieldName6'), $Field)
and then Select 'Suppress When Value Is Null' on the dimensions tab
- Mark as New
- Bookmark
- Subscribe
- Mute
- Subscribe to RSS Feed
- Permalink
- Report Inappropriate Content
I tried this in a dashboard with other fields and got No Data to display. I changed the field names to match what I have.
The expression I used too was: Count(email) - $(=concat('if($Field=' & chr(39) & $Field & chr(39) & ',nullcount([' & $Field & '])', ',') & concat(right($Field&')',1)))
I changed the Count(email) to match my unique field.
Let me know if I should be changing anything. This is great stuff you are doing here.
- Mark as New
- Bookmark
- Subscribe
- Mute
- Subscribe to RSS Feed
- Permalink
- Report Inappropriate Content
You might be already doing it, but you did not talk about it and I want to make sure you are not missing this, but do you have $Field as the dimension or not?
- Mark as New
- Bookmark
- Subscribe
- Mute
- Subscribe to RSS Feed
- Permalink
- Report Inappropriate Content
Sunny,
I think you could simplify the script a bit as:
-rangesum(Len(Trim(name)) > 0,
Len(Trim(email)) > 0,
Len(Trim(zipcode)) > 0,
Len(Trim(birthday)) > 0
) as DataPointCount
-Rob
- Mark as New
- Bookmark
- Subscribe
- Mute
- Subscribe to RSS Feed
- Permalink
- Report Inappropriate Content
Yes I am using the $Field as a dimension.
So I tried it with a new data set from an excel file and it works fine.
But my data set shows no data. When I remove $(=concat('if($Field=' & chr(39) & $Field & chr(39) & ',nullcount([' & $Field & '])', ',') & concat(right($Field&')',1))) from the expressions and just leave Count(Email) it shows a total overall same number for all fields. So for some reason that formula doesn't work with my data. I am taking it from an API call then doing a preload with the Len. Everything looks correct in the table view. I am still trying to modify this in order to get the unique count per field.
- Mark as New
- Bookmark
- Subscribe
- Mute
- Subscribe to RSS Feed
- Permalink
- Report Inappropriate Content
Just to add to this I exported my data out to excel and then into Qlikview to create a new QVW and it works. But I need it to work with the API call. I then made a QVD from the API call instead and it still doesn't work. I then made a new document and loaded the QVD into it and it works. I am wondering if it is because the field "Email" is a key to another table. In test documents I don't load the other table with the "Email" key.
Maybe this isn't possible to do.Just trying to wrap my head around why it doesn't work still. The formula is correct everywhere else though.