Unlock a world of possibilities! Login now and discover the exclusive benefits awaiting you.
- Qlik Community
- :
- All Forums
- :
- QlikView App Dev
- :
- Re: How to find out new and closed orders when com...
- Subscribe to RSS Feed
- Mark Topic as New
- Mark Topic as Read
- Float this Topic for Current User
- Bookmark
- Subscribe
- Mute
- Printer Friendly Page
- Mark as New
- Bookmark
- Subscribe
- Mute
- Subscribe to RSS Feed
- Permalink
- Report Inappropriate Content
How to find out new and closed orders when compared with previous week orders
Hi All ,
Am new to qlikview and as it often happens am stuck with a problem. Hope to get a good response here.
I want to find out new and closed orders when compared with previous week orders.
Below is the screen shot of sample data:

I have to find out below:
Order_id 6,7(line number 11,12) are the new orders in 2nd week compared to 1st week. (These both was not there in 1st week so new orders in 2nd week)
Order_id 12(line number 7) is the closed order when comparing 1st and 2nd week.(It was there in 1st week but not there in 2nd week)
Similarly for other week also..
Somehow found new orders but not able to get the closed orders.
Attaching the sample excel and QVW file whatever I am trying.
Please help me out.
Thanks
Sanki
Accepted Solutions
- Mark as New
- Bookmark
- Subscribe
- Mute
- Subscribe to RSS Feed
- Permalink
- Report Inappropriate Content
Script
compare_data:
LOAD Order_id,
Date,
Year(Date) as YEAR,
Num(Month(Date)) as MONTH,
Num(WeekDay(Date)) as DAY,
Num(Week(Date)) as WEEK,
Date(WeekStart(Date),'DD/MM/YYYY') as WEEK_START_DATE,
Date(Date,'YYYY')&Num(Week(Date))&Num(WeekDay(Date)) as DATE_ID
FROM
[Dummy data.xlsx]
(ooxml, embedded labels, table is Sheet1);
Table:
LOAD Order_id,
Min(WEEK) as WEEK,
'New Order' as Flag
Resident compare_data
Group By Order_id;
Concatenate (Table)
LOAD Order_id,
Max(WEEK)+1 as WEEK,
'Closed Order' as Flag
Resident compare_data
Group By Order_id;
Expressions
New Orders
=Count({<Flag = {'New Order'}>}Order_id)
Closed Orders
=Count({<Order_id = p({<Flag = {'Closed Order'}>})*e({<Flag = {'New Order'}>})>}Order_id)
- Mark as New
- Bookmark
- Subscribe
- Mute
- Subscribe to RSS Feed
- Permalink
- Report Inappropriate Content
try like this
Create a week from Date using.
Week(Date) as Week
And also have Year field created from Date
Year(Date)
Use below Expressions.
1. Sum(Sales) ---- For elected Week.
2. Sum({<Week = {"$(=week(max(Date)-7))"}>}Sales)
- Mark as New
- Bookmark
- Subscribe
- Mute
- Subscribe to RSS Feed
- Permalink
- Report Inappropriate Content
Script
compare_data:
LOAD Order_id,
Date,
Year(Date) as YEAR,
Num(Month(Date)) as MONTH,
Num(WeekDay(Date)) as DAY,
Num(Week(Date)) as WEEK,
Date(WeekStart(Date),'DD/MM/YYYY') as WEEK_START_DATE,
Date(Date,'YYYY')&Num(Week(Date))&Num(WeekDay(Date)) as DATE_ID
FROM
[Dummy data.xlsx]
(ooxml, embedded labels, table is Sheet1);
Table:
LOAD Order_id,
Min(WEEK) as WEEK,
'New Order' as Flag
Resident compare_data
Group By Order_id;
Concatenate (Table)
LOAD Order_id,
Max(WEEK)+1 as WEEK,
'Closed Order' as Flag
Resident compare_data
Group By Order_id;
Expressions
New Orders
=Count({<Flag = {'New Order'}>}Order_id)
Closed Orders
=Count({<Order_id = p({<Flag = {'Closed Order'}>})*e({<Flag = {'New Order'}>})>}Order_id)
- Mark as New
- Bookmark
- Subscribe
- Mute
- Subscribe to RSS Feed
- Permalink
- Report Inappropriate Content
Thanks a lot @Sunny Talwar. Great help.
Now I was trying to create a chart out of it.
To come up with a chart, for total order count, count of new orders, count of closed orders.
I have tried using the same thing whatever you have provided.
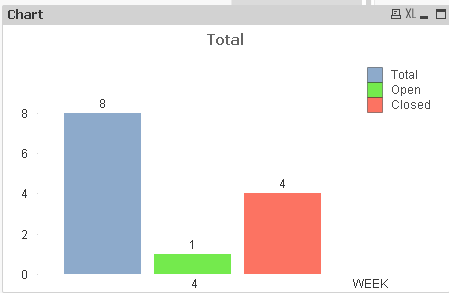

This is what I was able to get.
But the real problem is, above chart shows the values only when there is a selection of any of the week. But I need to have 6 weeks in my x-axis, then without the explicit selection of any week how do I show count of orders, new orders and closed orders for all my 6 weeks.
something like below screen shot:

I may be confusing in explaining, hope you understood my problem.
- Mark as New
- Bookmark
- Subscribe
- Mute
- Subscribe to RSS Feed
- Permalink
- Report Inappropriate Content
Can you attach the updated qvw file where you have built this bar chart?