Unlock a world of possibilities! Login now and discover the exclusive benefits awaiting you.
- Qlik Community
- :
- All Forums
- :
- QlikView App Dev
- :
- Re: How to fix this Bar chart with Line axis?
- Subscribe to RSS Feed
- Mark Topic as New
- Mark Topic as Read
- Float this Topic for Current User
- Bookmark
- Subscribe
- Mute
- Printer Friendly Page
- Mark as New
- Bookmark
- Subscribe
- Mute
- Subscribe to RSS Feed
- Permalink
- Report Inappropriate Content
How to fix this Bar chart with Line axis?
Hello,
I am having this visual which represents the Profit Percentage range vs the Sales Amount for the projects.
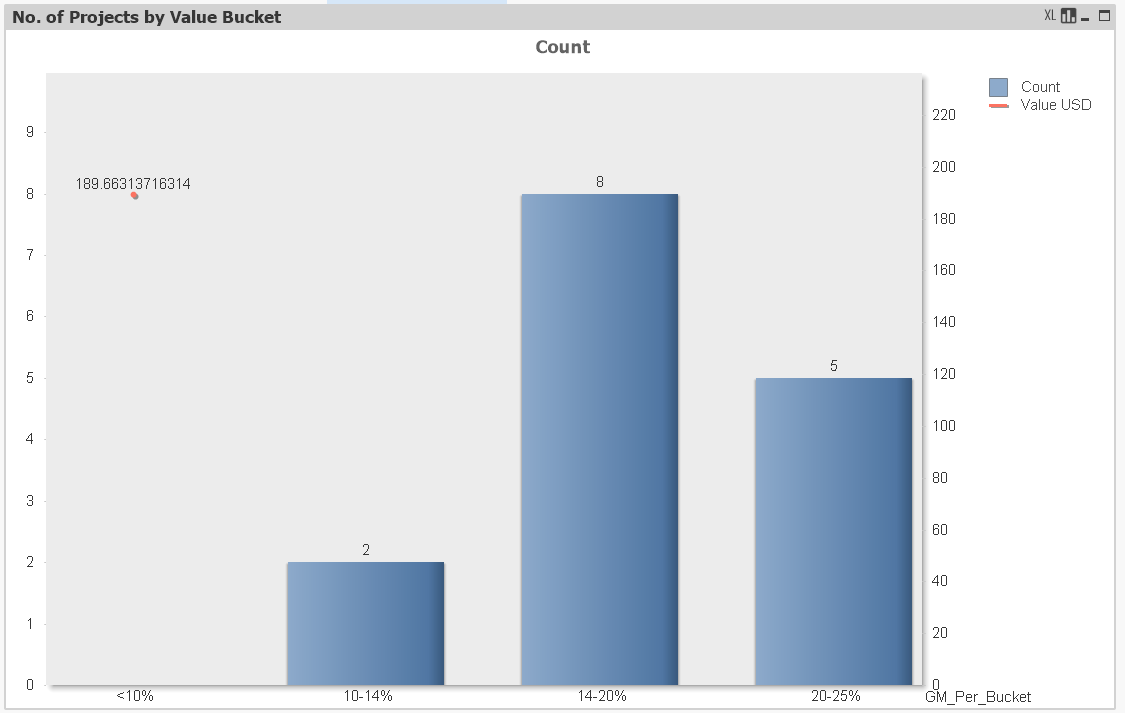
But the Sales amount is summing up all the project no's and not showing as a line axis.
Can you please tell me what should I need to fix here?
thanks
Bhavesh
Accepted Solutions
- Mark as New
- Bookmark
- Subscribe
- Mute
- Subscribe to RSS Feed
- Permalink
- Report Inappropriate Content
A chart aggregates all its expressions to the dimension. As you do not have a dimension for Project, the chart aggregates the data to the dimension (GM_Per_Bucket).
If you want to use multiple dimensions use
https://help.qlik.com/en-US/qlikview/November2017/Subsystems/Client/Content/ChartFunctions/aggr.htm
Also, please have a look at the following
QlikView: Multiple Dimensions and Expressions in Bar Chart - ΛUΤΟΞΧΞ©
- Mark as New
- Bookmark
- Subscribe
- Mute
- Subscribe to RSS Feed
- Permalink
- Report Inappropriate Content
May be add Project No as Dimension.
Your dimension says 'GM_Per_Bucket'
- Mark as New
- Bookmark
- Subscribe
- Mute
- Subscribe to RSS Feed
- Permalink
- Report Inappropriate Content
Hi,
I have already added another expression which counts the project count as given below;
=count({<Report_Param ={'Gross Profit in % of Sales'}, Header_2= {'Budget'}, Header_1= {'Upd.OEC'}>}Project_Number)
- Mark as New
- Bookmark
- Subscribe
- Mute
- Subscribe to RSS Feed
- Permalink
- Report Inappropriate Content
A chart aggregates all its expressions to the dimension. As you do not have a dimension for Project, the chart aggregates the data to the dimension (GM_Per_Bucket).
If you want to use multiple dimensions use
https://help.qlik.com/en-US/qlikview/November2017/Subsystems/Client/Content/ChartFunctions/aggr.htm
Also, please have a look at the following
QlikView: Multiple Dimensions and Expressions in Bar Chart - ΛUΤΟΞΧΞ©