Unlock a world of possibilities! Login now and discover the exclusive benefits awaiting you.
- Qlik Community
- :
- All Forums
- :
- QlikView App Dev
- :
- How to format values on data points total on top(s...
- Subscribe to RSS Feed
- Mark Topic as New
- Mark Topic as Read
- Float this Topic for Current User
- Bookmark
- Subscribe
- Mute
- Printer Friendly Page
- Mark as New
- Bookmark
- Subscribe
- Mute
- Subscribe to RSS Feed
- Permalink
- Report Inappropriate Content
How to format values on data points total on top(stacked charts)
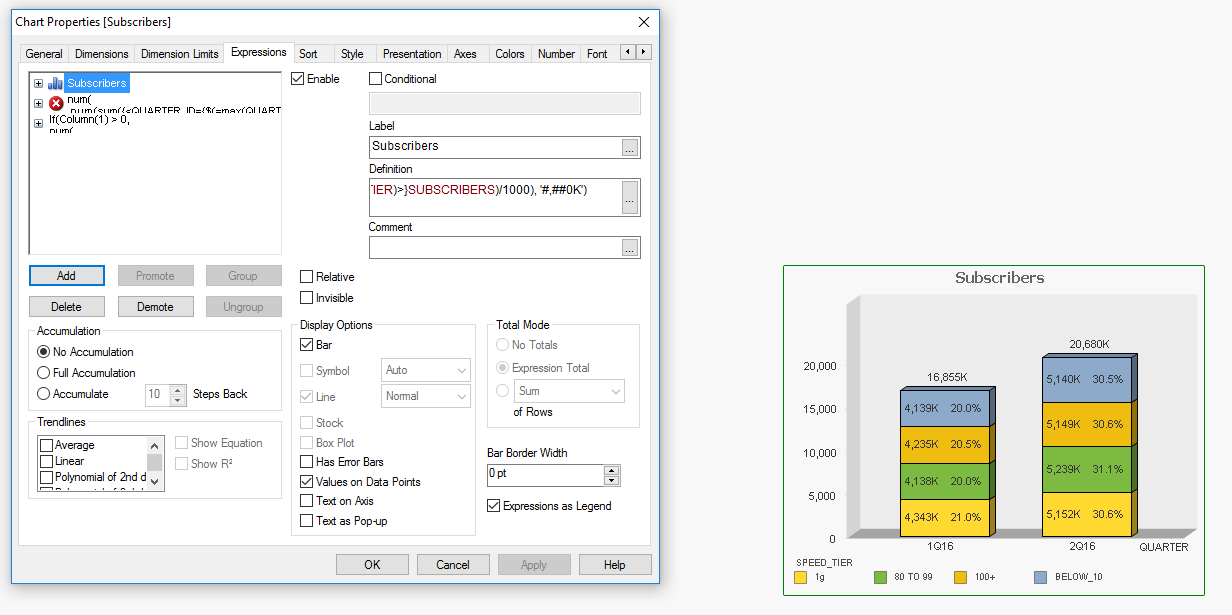
Is there a way to format values on data points on top with stacked charts ?
I would like the values of 16855 & 20680 to display as 16,855 & 20,680
Within the stacked charts I am displaying the sum & percentage which display correctly (using the Plot Values Inside Segments & Still Show Total on Top within the Presentation tab) however the total on top of stacked charts are not displaying the commas.
I need to use the Expression Default otherwise the format within the stacked bars will not display. Therefore I am unable to change the format to anything other than Expression Default within the Number tab.
Any ideas?
Attached is a sample of what I'm trying to accomplish.
Accepted Solutions
- Mark as New
- Bookmark
- Subscribe
- Mute
- Subscribe to RSS Feed
- Permalink
- Report Inappropriate Content
May be using two expressions where the second expression is just used for label?
- Mark as New
- Bookmark
- Subscribe
- Mute
- Subscribe to RSS Feed
- Permalink
- Report Inappropriate Content
You can use this
Num(Expression,'##,##0')
- Mark as New
- Bookmark
- Subscribe
- Mute
- Subscribe to RSS Feed
- Permalink
- Report Inappropriate Content
Thank You Anil,
I am using the following Num(Expression,
'#,##0K')
& it does not display the commas at the top totals of stacked bar.
- Mark as New
- Bookmark
- Subscribe
- Mute
- Subscribe to RSS Feed
- Permalink
- Report Inappropriate Content
May be using two expressions where the second expression is just used for label?
- Mark as New
- Bookmark
- Subscribe
- Mute
- Subscribe to RSS Feed
- Permalink
- Report Inappropriate Content
Can i know your metrics?
- Mark as New
- Bookmark
- Subscribe
- Mute
- Subscribe to RSS Feed
- Permalink
- Report Inappropriate Content
Thank You Sunny - that did it!! 
Could you explain the Column(1)?
- Mark as New
- Bookmark
- Subscribe
- Mute
- Subscribe to RSS Feed
- Permalink
- Report Inappropriate Content
maybe close the dicussion
- Mark as New
- Bookmark
- Subscribe
- Mute
- Subscribe to RSS Feed
- Permalink
- Report Inappropriate Content
Used Column(1) to just make sure we don't see a third bar which was showing up for some reason. So, basically show the labels wherever we have value in expression 1. Try removing the if statement and see what happens and you will see why I added this if statement
- Mark as New
- Bookmark
- Subscribe
- Mute
- Subscribe to RSS Feed
- Permalink
- Report Inappropriate Content
Thank You Sunny, for the explanation regarding Column(1).
I removed the If statement like you suggested & I now see why you added the If Column(1).
Thank You Again, you've been very helpful!
- Mark as New
- Bookmark
- Subscribe
- Mute
- Subscribe to RSS Feed
- Permalink
- Report Inappropriate Content
Hello Sunny,
I also have same requirement
my expression is : if(Signrequestdate=1,count({<[Trx Type]={"*"},DateType={"OrderDate"}>}[Sales Order ID]),
if(Signrequestdate=0,count({<[Trx Type]={"*"},DateType={"SignDate"}>}[Sales Order ID])))
but i want number formatting like below:
If(<expression> >= 1000000000, Num(<expression>/1000000000, '#,##0.0 B'),
If(<expression> >= 1000000, Num(<expression>/1000000, '#,##0.0 M'),
If(<expression> >= 1000, Num(<expression>/1000, '#,##0.0 K'),
Num(<expression>, '#,##0.0'))))
Once I am replacing my expression, with this expression, it is working in inside the segment of stacked bar graph
but on total, it is not working
I am not understanding your above solution.
can you please explain how and what you did.
thanks,
shikha