Unlock a world of possibilities! Login now and discover the exclusive benefits awaiting you.
- Qlik Community
- :
- All Forums
- :
- QlikView App Dev
- :
- Re: How to get Sorted value?
- Subscribe to RSS Feed
- Mark Topic as New
- Mark Topic as Read
- Float this Topic for Current User
- Bookmark
- Subscribe
- Mute
- Printer Friendly Page
- Mark as New
- Bookmark
- Subscribe
- Mute
- Subscribe to RSS Feed
- Permalink
- Report Inappropriate Content
How to get Sorted value?
Hi Experts,
I have following data
| Type | Month_number | Month | Year | Rate | Avg | RollingSum |
| ARP | 1 | 1 | 201501 | 8.5553 | 8.5553 | 8.5553 |
| ARP | 2 | 1 | 201501 | 8.5626 | 8.55895 | 17.1179 |
| ARP | 3 | 1 | 201501 | 8.5523 | 8.556733333 | 25.6702 |
| ARP | 4 | 1 | 201501 | 8.5823 | 8.563125 | 34.2525 |
| ARP | 5 | 1 | 201501 | 8.5913 | 8.56876 | 42.8438 |
| ARP | 6 | 1 | 201501 | 8.5912 | 8.5725 | 51.435 |
| ARP | 7 | 1 | 201501 | 8.5912 | 8.575171429 | 60.0262 |
| ARP | 8 | 1 | 201501 | 8.5912 | 8.577175 | 68.6174 |
| ARP | 9 | 1 | 201501 | 8.5918 | 8.5788 | 77.2092 |
| ARP | 10 | 1 | 201501 | 8.5914 | 8.58006 | 85.8006 |
I want Type wise, Max(Month_Number) wise, year wise avg. In this case 8.58006.
What expression should I write for this?
Accepted Solutions
- Mark as New
- Bookmark
- Subscribe
- Mute
- Subscribe to RSS Feed
- Permalink
- Report Inappropriate Content
Ue below exp :
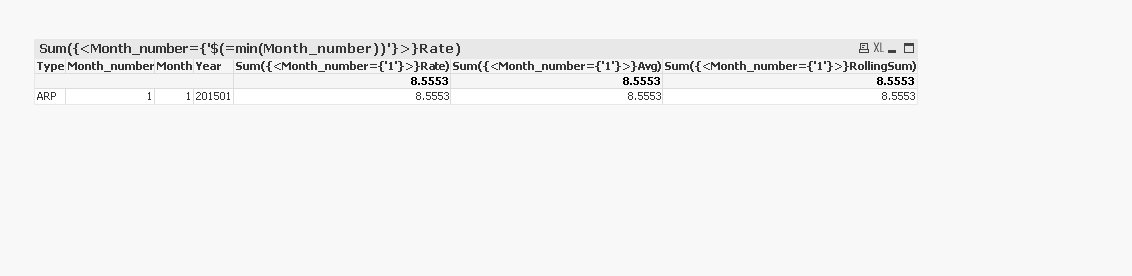
Rate: Sum({<Month_number={'$(=min(Month_number))'}>}Rate)
Avg: Sum({<Month_number={'$(=min(Month_number))'}>}Avg)
Rooling sum : Sum({<Month_number={'$(=min(Month_number))'}>}RollingSum)
I hope this mat helps you.
-Nagarjun
- Mark as New
- Bookmark
- Subscribe
- Mute
- Subscribe to RSS Feed
- Permalink
- Report Inappropriate Content
Where are you looking to get this, text box object or chart? If it is a chart what all are going to you dimensions?
- Mark as New
- Bookmark
- Subscribe
- Mute
- Subscribe to RSS Feed
- Permalink
- Report Inappropriate Content
Want to display in Bar chart Type wise, Max(Month_Number) wise, year wise
- Mark as New
- Bookmark
- Subscribe
- Mute
- Subscribe to RSS Feed
- Permalink
- Report Inappropriate Content
Ue below exp :
Rate: Sum({<Month_number={'$(=min(Month_number))'}>}Rate)
Avg: Sum({<Month_number={'$(=min(Month_number))'}>}Avg)
Rooling sum : Sum({<Month_number={'$(=min(Month_number))'}>}RollingSum)
I hope this mat helps you.
-Nagarjun
- Mark as New
- Bookmark
- Subscribe
- Mute
- Subscribe to RSS Feed
- Permalink
- Report Inappropriate Content
which chart you are using? what is expected output for this
- Mark as New
- Bookmark
- Subscribe
- Mute
- Subscribe to RSS Feed
- Permalink
- Report Inappropriate Content
Hi nachiket.shinde.1981
You can use expression FirstSortedValue(Avg,-aggr(Avg,Year,Month_number)) for the expected results.
Please refer the attachment and if the result is not as requested then please share dimensions details to be used in the chart.
Rajpreeth S
- Mark as New
- Bookmark
- Subscribe
- Mute
- Subscribe to RSS Feed
- Permalink
- Report Inappropriate Content
Hi ,
I forgot to mention one point,
Type should be added in the aggr expression if you have multiple values for Type field in data model. ( For type wise data)
FirstSortedValue(Avg,-aggr(Avg,Type,Year,Month_number))
Rajpreeth S
- Mark as New
- Bookmark
- Subscribe
- Mute
- Subscribe to RSS Feed
- Permalink
- Report Inappropriate Content
Use a straight table and apply sorting