Unlock a world of possibilities! Login now and discover the exclusive benefits awaiting you.
- Qlik Community
- :
- All Forums
- :
- QlikView App Dev
- :
- Re: How to get Uniform scale on x-axis for Calcul...
Options
- Subscribe to RSS Feed
- Mark Topic as New
- Mark Topic as Read
- Float this Topic for Current User
- Bookmark
- Subscribe
- Mute
- Printer Friendly Page
Turn on suggestions
Auto-suggest helps you quickly narrow down your search results by suggesting possible matches as you type.
Showing results for
Partner - Creator
2015-11-25
05:26 AM
- Mark as New
- Bookmark
- Subscribe
- Mute
- Subscribe to RSS Feed
- Permalink
- Report Inappropriate Content
How to get Uniform scale on x-axis for Calculated Dimension ??
Hi All,
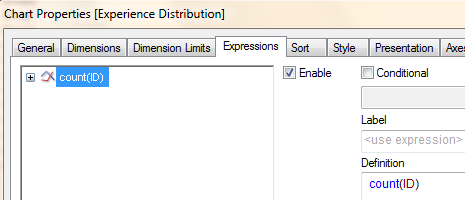
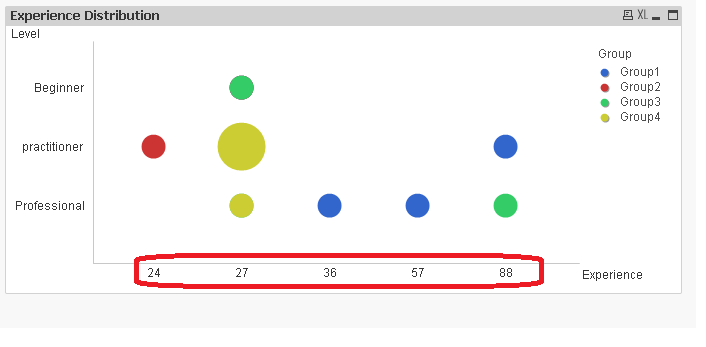
I am trying to create a bubble chart(Grid chart) using 3 dimension and 1 expression, out of which 1 is a calculated dimension (Experience=today()-issue_date) shown below

I want to achieve uniform scale (like 1,2,3,4) on x-axis for this calculated dimension in bubble graph.
Can anybody suggest me any alternative to achieve this.
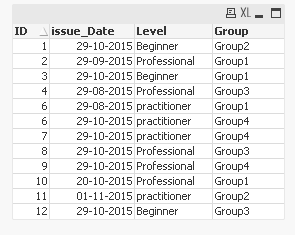
I have attached below sample data
Thanks and Regards,
Sabahat
- Tags:
- new_to_qlikview
906 Views
3 Replies
Partner - Specialist
2015-11-25
06:54 AM
- Mark as New
- Bookmark
- Subscribe
- Mute
- Subscribe to RSS Feed
- Permalink
- Report Inappropriate Content
Hi
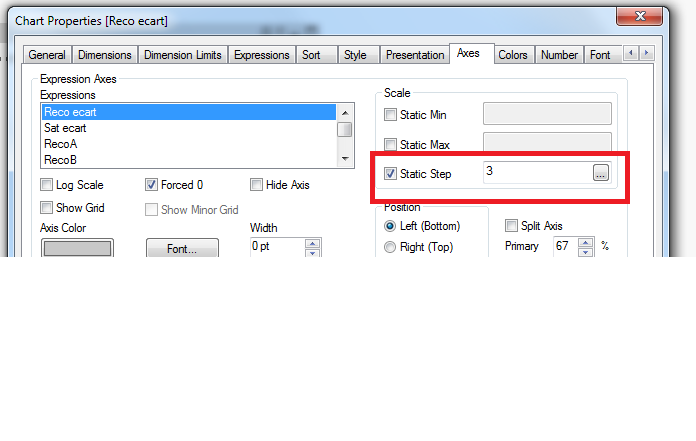
in axes sheet (object properties ) you will find an input field called static step .use it to achieve what you seeking for .
763 Views
Partner - Champion III
2015-11-25
07:00 AM
- Mark as New
- Bookmark
- Subscribe
- Mute
- Subscribe to RSS Feed
- Permalink
- Report Inappropriate Content
See attached example.
talk is cheap, supply exceeds demand
Partner - Creator
2015-11-25
07:43 AM
Author
- Mark as New
- Bookmark
- Subscribe
- Mute
- Subscribe to RSS Feed
- Permalink
- Report Inappropriate Content
Thanks a lot Gysbert. Its really useful.
Regards,
Sabahat
763 Views