Unlock a world of possibilities! Login now and discover the exclusive benefits awaiting you.
- Qlik Community
- :
- All Forums
- :
- QlikView App Dev
- :
- Re: How to get dimensions of month and year from c...
- Subscribe to RSS Feed
- Mark Topic as New
- Mark Topic as Read
- Float this Topic for Current User
- Bookmark
- Subscribe
- Mute
- Printer Friendly Page
- Mark as New
- Bookmark
- Subscribe
- Mute
- Subscribe to RSS Feed
- Permalink
- Report Inappropriate Content
How to get dimensions of month and year from cross table data
Hi,
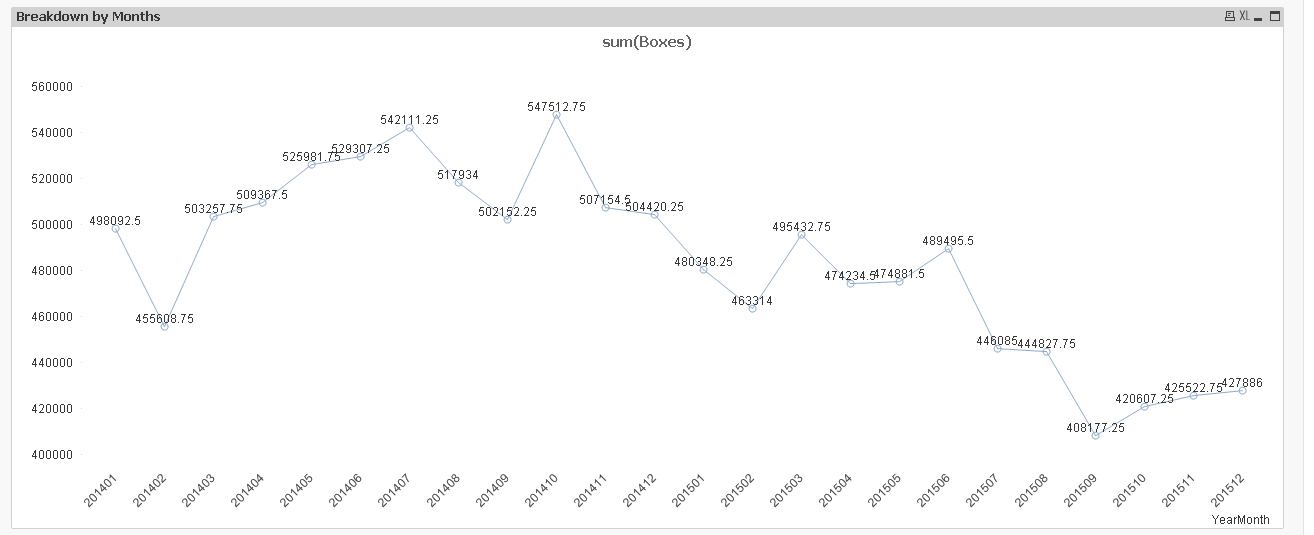
as per screen shot, I need the following to be displayed as Months and 2 lines representing the years.
The data for the YearMonth had been cross table
I could use excel to create a whole new column for Month and another for Year to do it but I think there should be a way in Qlikview.
Any help would be very much appreciated.
thank you


Accepted Solutions
- Mark as New
- Bookmark
- Subscribe
- Mute
- Subscribe to RSS Feed
- Permalink
- Report Inappropriate Content
Create a Year and Month field in resident load after your CrossTable Load and use Month as your first dimension and Year as your second dimension in the above chart.
- Mark as New
- Bookmark
- Subscribe
- Mute
- Subscribe to RSS Feed
- Permalink
- Report Inappropriate Content
Create a Year and Month field in resident load after your CrossTable Load and use Month as your first dimension and Year as your second dimension in the above chart.
- Mark as New
- Bookmark
- Subscribe
- Mute
- Subscribe to RSS Feed
- Permalink
- Report Inappropriate Content
With these example script you can get YEAR and MONTH
WITH 201401:
YEAR(MAKEDATE(LEFT('201401',4), RIGHT('201401',2)*1))
MONTH(MAKEDATE(LEFT('201401',4), RIGHT('201401',2)*1))
Regards,
- Mark as New
- Bookmark
- Subscribe
- Mute
- Subscribe to RSS Feed
- Permalink
- Report Inappropriate Content
Hi,
How should I go about creating the Year and Month field please?
Thanks
- Mark as New
- Bookmark
- Subscribe
- Mute
- Subscribe to RSS Feed
- Permalink
- Report Inappropriate Content
Hi,
I have managed with the direction of resident Load.
Is alot more complicated than I expected and also needed to define the Month and Year.
thank you for pointing me in the right direction.
///
FROM
(biff, embedded labels);
NoConcatenate
New:
LOAD
***
Month(Date(Date#([When],'YYYYMM'))) as Month,
Year(Date(Date#([When],'YYYYMM'))) as Year
Resident first;
DROP Table first;
///
- Mark as New
- Bookmark
- Subscribe
- Mute
- Subscribe to RSS Feed
- Permalink
- Report Inappropriate Content
May be something like this:
FinalTable:
LOAD *,
Year(YearMonth) as Year,
Month(YearMonth) as Month;
LOAD Total_2014,
Total_2015,
Type,
Line,
[Trade Route],
[Port Pair],
Date(Date#(YearMonth, ‘YYYYMM’) , ‘YYYYMM’) as YearMonth,
Boxes
Resident AboveCrossTableNameHere;