Unlock a world of possibilities! Login now and discover the exclusive benefits awaiting you.
- Qlik Community
- :
- All Forums
- :
- QlikView App Dev
- :
- How to get monthly average sales per product?
- Subscribe to RSS Feed
- Mark Topic as New
- Mark Topic as Read
- Float this Topic for Current User
- Bookmark
- Subscribe
- Mute
- Printer Friendly Page
- Mark as New
- Bookmark
- Subscribe
- Mute
- Subscribe to RSS Feed
- Permalink
- Report Inappropriate Content
How to get monthly average sales per product?
Hi everyone,
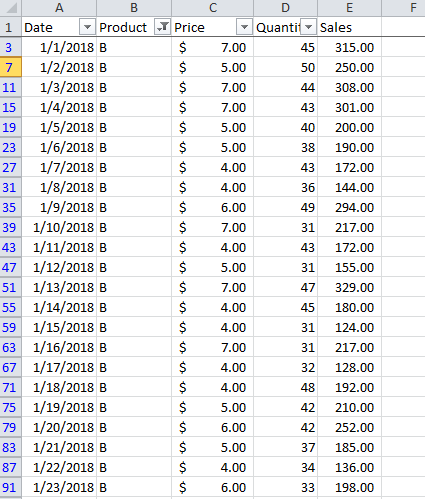
I'm creating a chart which displays the monthly average sales per product however I have a daily data set in Excel.
In the Expressions tab, I used this expression: =Avg(Aggr(Sum(Sales),Date,Product)) and upon applying, chart looked like this
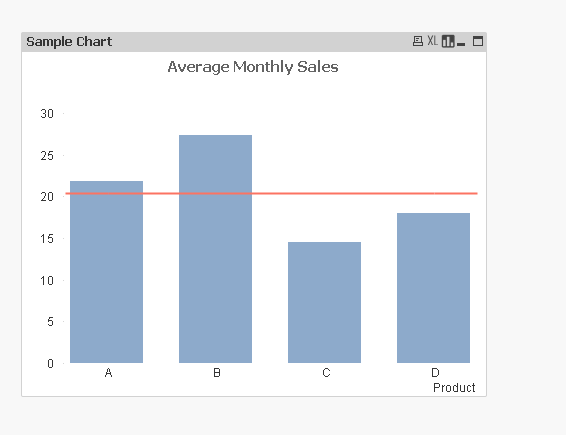
The scale was a lot smaller since I have data set in daily format but what I need is the monthly averages.
I've also tried editing the Script using the MonthStart string to no avail. Hope someone can help me on this.
Thanks!
Accepted Solutions
- Mark as New
- Bookmark
- Subscribe
- Mute
- Subscribe to RSS Feed
- Permalink
- Report Inappropriate Content
Have you tried this?
=Avg(Aggr(Sum(Sales),MonthYear,Product))
Where MonthYear is calculated in the script like this
Date(MonthStart(Date), 'MMM-YYYY') as MonthYear
- Mark as New
- Bookmark
- Subscribe
- Mute
- Subscribe to RSS Feed
- Permalink
- Report Inappropriate Content
Have you tried this?
=Avg(Aggr(Sum(Sales),MonthYear,Product))
Where MonthYear is calculated in the script like this
Date(MonthStart(Date), 'MMM-YYYY') as MonthYear
- Mark as New
- Bookmark
- Subscribe
- Mute
- Subscribe to RSS Feed
- Permalink
- Report Inappropriate Content
I did it! Thanks for the help!