Unlock a world of possibilities! Login now and discover the exclusive benefits awaiting you.
- Qlik Community
- :
- All Forums
- :
- QlikView App Dev
- :
- Re: How to get this kind of viz
- Subscribe to RSS Feed
- Mark Topic as New
- Mark Topic as Read
- Float this Topic for Current User
- Bookmark
- Subscribe
- Mute
- Printer Friendly Page
- Mark as New
- Bookmark
- Subscribe
- Mute
- Subscribe to RSS Feed
- Permalink
- Report Inappropriate Content
How to get this kind of viz
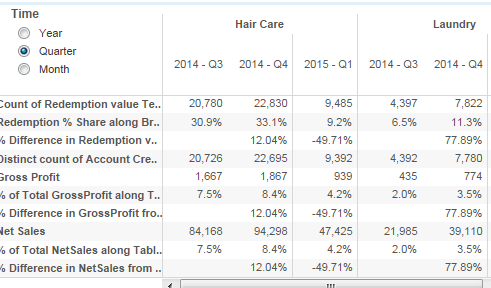
which object should be used for this ?
- Tags:
- new_to_qlikview
- Mark as New
- Bookmark
- Subscribe
- Mute
- Subscribe to RSS Feed
- Permalink
- Report Inappropriate Content
Hi ,
Please check this ,
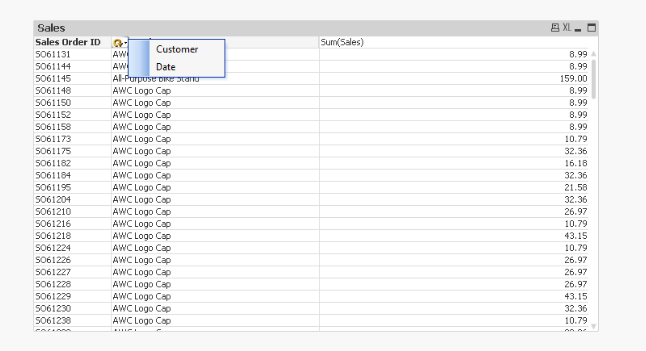
Drop Down for Dimensions,
PFA,
Hope This Helps,
Regards,
Hirish
- Mark as New
- Bookmark
- Subscribe
- Mute
- Subscribe to RSS Feed
- Permalink
- Report Inappropriate Content
You can try this using Pivot Table. For, Time ListBox => Try with LED Check boxes in Presentation Tab, And In General Tab -> Always one selected value
- Mark as New
- Bookmark
- Subscribe
- Mute
- Subscribe to RSS Feed
- Permalink
- Report Inappropriate Content
Hello,
Pivot Table is the solution I think.
I attached a QVW with 2 samples with something close of what you are looking for.
One is using the method of Group (Edit Group at Dimension Tab) which is the one proposed by Hirish and the other one using a container with 3 different graphs (one per dimension).
There is one issue, I have not been able to solve, which is that the label width for lines is linked to column width. So you can't do like in your sample a large column to display the KPI labels.
Regards
Gilles
- Mark as New
- Bookmark
- Subscribe
- Mute
- Subscribe to RSS Feed
- Permalink
- Report Inappropriate Content
or use bookmark...
- Mark as New
- Bookmark
- Subscribe
- Mute
- Subscribe to RSS Feed
- Permalink
- Report Inappropriate Content
Hi Uday,
First of all create a data island table for time dimension like
| Time Dimension |
|---|
| Month |
| Quarter |
| Year |
Create a list box from this with one selected value.
In your pivot table add Year, Quarter and Month dimensions each with a condition such as this for the Year dimension
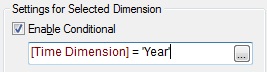
Hope this helps
- Mark as New
- Bookmark
- Subscribe
- Mute
- Subscribe to RSS Feed
- Permalink
- Report Inappropriate Content
Hi,
Please post an example app it will be helpful.
Thanks & regards,
Hirish