Unlock a world of possibilities! Login now and discover the exclusive benefits awaiting you.
- Qlik Community
- :
- All Forums
- :
- QlikView App Dev
- :
- Re: How to get three Consecutive months
- Subscribe to RSS Feed
- Mark Topic as New
- Mark Topic as Read
- Float this Topic for Current User
- Bookmark
- Subscribe
- Mute
- Printer Friendly Page
- Mark as New
- Bookmark
- Subscribe
- Mute
- Subscribe to RSS Feed
- Permalink
- Report Inappropriate Content
How to get three months
Hi Dear Experts,
I have month column in my fields list.
Here based on Month selections i have to display three Consecutive Months in pivot table
Here is my Month filed Current im using "Month(MonthStart(Date(Mid([MTRC_FCT_DT],1,8)))) as Month"
Any suggestions how to achieve this
Ex:
if Month= Jan (Month-2, Month-1,Month)
O/P= Nov, Dec,Jan
if Month= Feb (Month-2, Month-1,Month)
O/P= Dec,Jan, Feb
if Month= Mar, (Month-2, Month-1,Month)
O/P= Jan, Feb,Mar
Best Regards,
Niranjan
- « Previous Replies
-
- 1
- 2
- Next Replies »
Accepted Solutions
- Mark as New
- Bookmark
- Subscribe
- Mute
- Subscribe to RSS Feed
- Permalink
- Report Inappropriate Content
Create a variable vMonth: =if(len(GetCurrentSelections()),max(MonthYear),MonthStart(Today()))
Change the expression to =Count({<Month=, MonthYear={">=$(=date(MonthStart($(vMonth),-2),'MMM YY'))<=$(=Date($(vMonth),'MMM YY'))"}>}RAG_RATING_CD)
talk is cheap, supply exceeds demand
- Mark as New
- Bookmark
- Subscribe
- Mute
- Subscribe to RSS Feed
- Permalink
- Report Inappropriate Content
You can either use set analysis or use the concept of As-of Table: The As-Of Table
- Mark as New
- Bookmark
- Subscribe
- Mute
- Subscribe to RSS Feed
- Permalink
- Report Inappropriate Content
Won't work if you only have the month numbers. 1 - 2 = -1 and not 12. So you need a date field like Date(MonthStart(Date(Mid([MTRC_FCT_DT],1,8))),'MMM YY') as MonthYear. Then you can select the 3-month period in your chart expressions. For example sum(Amount) would become sum({<Month=, MonthYear={">=$(=MonthStart(max(MonthYear),-2))<=$(=max(MonthYear))"}>}Amount)
talk is cheap, supply exceeds demand
- Mark as New
- Bookmark
- Subscribe
- Mute
- Subscribe to RSS Feed
- Permalink
- Report Inappropriate Content
Hi Gysbert,
Thanks for your reply
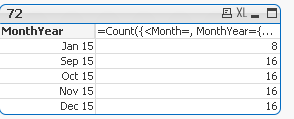
=Count({<Month=, MonthYear={">=$(=MonthStart(max(MonthYear),-2))<=$(=max(MonthYear))"}>}RATING_CB)
with this expression i got the below result, can't we restrict to display only three months data
any suggestions
Best Regards,
Niranjan
- Mark as New
- Bookmark
- Subscribe
- Mute
- Subscribe to RSS Feed
- Permalink
- Report Inappropriate Content
Pl Chk the value of set expression in the header of expression column, smthg might be wrong else expression shouldn't show more than 3 months.
- Mark as New
- Bookmark
- Subscribe
- Mute
- Subscribe to RSS Feed
- Permalink
- Report Inappropriate Content
That result make no sense at all. Can you post a small qlikview document that demonstrates the problem?
talk is cheap, supply exceeds demand
- Mark as New
- Bookmark
- Subscribe
- Mute
- Subscribe to RSS Feed
- Permalink
- Report Inappropriate Content
Hi Gysbert,
Sorry for my late reply, i have attached sample document
Here based on month selections in pivot i have to display 3months of data
Ex:
if Month= Jan (Month-2, Month-1,Month)
O/P= Nov, Dec,Jan
Best Regards,
Niranjan
- Mark as New
- Bookmark
- Subscribe
- Mute
- Subscribe to RSS Feed
- Permalink
- Report Inappropriate Content
Try this expression:
=Count({<Month=, MonthYear={">=$(=date(MonthStart(max(MonthYear),-2),'MMM YY'))<=$(=Date(max(MonthYear),'MMM YY'))"}>}RAG_RATING_CD)
talk is cheap, supply exceeds demand
- Mark as New
- Bookmark
- Subscribe
- Mute
- Subscribe to RSS Feed
- Permalink
- Report Inappropriate Content
Hi Gysbert,
its working fine, But if can i clear the filters chart its not displaying any data
how can i make it current month as default selection
Best Regards,
Niranjan
- Mark as New
- Bookmark
- Subscribe
- Mute
- Subscribe to RSS Feed
- Permalink
- Report Inappropriate Content
Create a variable vMonth: =if(len(GetCurrentSelections()),max(MonthYear),MonthStart(Today()))
Change the expression to =Count({<Month=, MonthYear={">=$(=date(MonthStart($(vMonth),-2),'MMM YY'))<=$(=Date($(vMonth),'MMM YY'))"}>}RAG_RATING_CD)
talk is cheap, supply exceeds demand
- « Previous Replies
-
- 1
- 2
- Next Replies »