Unlock a world of possibilities! Login now and discover the exclusive benefits awaiting you.
- Qlik Community
- :
- All Forums
- :
- QlikView App Dev
- :
- Re: How to get totals in pivot as shown in the bel...
- Subscribe to RSS Feed
- Mark Topic as New
- Mark Topic as Read
- Float this Topic for Current User
- Bookmark
- Subscribe
- Mute
- Printer Friendly Page
- Mark as New
- Bookmark
- Subscribe
- Mute
- Subscribe to RSS Feed
- Permalink
- Report Inappropriate Content
How to get totals in pivot as shown in the below Image
Hi All
I want to create a pivot table which shows totals as shown in the image , I have attached an sample Qv applications where i have tried different types of options 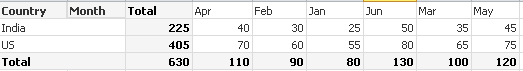
Regards
Harsha
- Tags:
- new_to_qlikview
- Mark as New
- Bookmark
- Subscribe
- Mute
- Subscribe to RSS Feed
- Permalink
- Report Inappropriate Content
Go to Chart Properties > Presentation > tick 'Show Partial Sums'
- Mark as New
- Bookmark
- Subscribe
- Mute
- Subscribe to RSS Feed
- Permalink
- Report Inappropriate Content
Thanks for the quick response but i was not able to get it as it is shown in the image please look at the sample QlikVIew application which I have attached
- Mark as New
- Bookmark
- Subscribe
- Mute
- Subscribe to RSS Feed
- Permalink
- Report Inappropriate Content
I think this one is not possible in Pivot Table to show Total in front of Column and Row. In last it is possible and you have attached the same .
- Mark as New
- Bookmark
- Subscribe
- Mute
- Subscribe to RSS Feed
- Permalink
- Report Inappropriate Content
attached the app as per your screen shot
- Mark as New
- Bookmark
- Subscribe
- Mute
- Subscribe to RSS Feed
- Permalink
- Report Inappropriate Content
Hi,
We need to use out-of-the-box. Here is Method 3
1. Load this script
LOAD * INLINE [
    Country, Month, Sale
    India, Jan, 25
    India, Feb, 30
    India, Mar, 35
    India, Apr, 40
    India, May, 45
    India, Jun, 50
    US, Jan, 55
    US, Feb, 60
    US, Mar, 65
    US, Apr, 70
    US, May, 75
    US, Jun, 80
];


[ContryTable]:
LOAD FieldValue('Country',IterNo()) AS Country
AutoGenerate 1
While Len(FieldValue('Country',IterNo()));


Totals:
LOAD
 'Total' AS NewCountry,
 Country
Resident ContryTable;


CONCATENATE (Totals)
LOAD
 Country AS NewCountry,
 Country
Resident ContryTable;


DROP TABLE ContryTable;
2. Create Pivot Table with
Dimension: NewCountry and Month
Expression: Sum(Sale)
3. Drag Month horizontal (pivot)
4. In NewCountry dimension -> Click  sign -> Select "Text Format" -> Click Edit -> use this expression =If(NewCountry='Total','<B>')
5. Repeat No 4 for each expression.
See sample attached file.
Regards,
Sokkorn
- Mark as New
- Bookmark
- Subscribe
- Mute
- Subscribe to RSS Feed
- Permalink
- Report Inappropriate Content
Hi,
In pivot chart, you can not set subtotal settings for eact dimension. On presentation tab check the radio button for "Subtotals on Top" or "Subtotal on Bottom". This setting is chart level setting using which you can get subtotal either on bottom and last row or top and first row.
- Mark as New
- Bookmark
- Subscribe
- Mute
- Subscribe to RSS Feed
- Permalink
- Report Inappropriate Content
Thanks Nagaraj,
Only constraint that i have is, columns are not fixed. I mean to say i have variable column headers. The example that i have attached might have to be changed a little bit to avoid confusion(apologies for the same).
What to do, If i have to replace the months column with Sales person wherein Sales persons names are not coming from a fixed list?