Unlock a world of possibilities! Login now and discover the exclusive benefits awaiting you.
- Qlik Community
- :
- All Forums
- :
- QlikView App Dev
- :
- How to group mins into time interval
- Subscribe to RSS Feed
- Mark Topic as New
- Mark Topic as Read
- Float this Topic for Current User
- Bookmark
- Subscribe
- Mute
- Printer Friendly Page
- Mark as New
- Bookmark
- Subscribe
- Mute
- Subscribe to RSS Feed
- Permalink
- Report Inappropriate Content
How to group mins into time interval
For the time column
24
201
11
43
21
57
0
121
22
4
159
0
2
46
Need to group them into Time interval:
15 - 120min
120 - 240min
240 - 360min
each interval is 120min
- Mark as New
- Bookmark
- Subscribe
- Mute
- Subscribe to RSS Feed
- Permalink
- Report Inappropriate Content
I believe it should still work with thousands or million of rows of data. I am not sure I understand your concern.
- Mark as New
- Bookmark
- Subscribe
- Mute
- Subscribe to RSS Feed
- Permalink
- Report Inappropriate Content
Hi,
another solution could be:
table1:
LOAD *,
    If(time<15,Dual('<15min',14),If(time>=15 and time<120,Dual('15 - 120min',15),Dual(Replace(Class(time,120),'<= x <','-')&'min',Class(time,120)))) as [time interval];
LOAD Floor(Rand()*500) as time
AutoGenerate 30;
hope this helps
regards
Marco
- Mark as New
- Bookmark
- Subscribe
- Mute
- Subscribe to RSS Feed
- Permalink
- Report Inappropriate Content
I see there are 5 rows of 15 - 120 min, is there a way to group it together and replace the time column as 5 and a unique time interval as 15 - 120min?
- Mark as New
- Bookmark
- Subscribe
- Mute
- Subscribe to RSS Feed
- Permalink
- Report Inappropriate Content
You mean like
count([time interval])
?
Yes, of course.
Regards
Marco
- Mark as New
- Bookmark
- Subscribe
- Mute
- Subscribe to RSS Feed
- Permalink
- Report Inappropriate Content
example:
hope this helps
regards
Marco
- Mark as New
- Bookmark
- Subscribe
- Mute
- Subscribe to RSS Feed
- Permalink
- Report Inappropriate Content
Is there a way to open your file? I'm using personal edition
- Mark as New
- Bookmark
- Subscribe
- Mute
- Subscribe to RSS Feed
- Permalink
- Report Inappropriate Content
create new qvw, copy my script and paste it using the script editor.
reload, create a chart straight table using time interval as dimension and count([time interval]) as expression.
regards
Marco
- Mark as New
- Bookmark
- Subscribe
- Mute
- Subscribe to RSS Feed
- Permalink
- Report Inappropriate Content
How come the count all total as 30?
- Mark as New
- Bookmark
- Subscribe
- Mute
- Subscribe to RSS Feed
- Permalink
- Report Inappropriate Content
it's the sum
2+6+5+11+5+1 = 30
hope this helps
regards
Marco
- Mark as New
- Bookmark
- Subscribe
- Mute
- Subscribe to RSS Feed
- Permalink
- Report Inappropriate Content

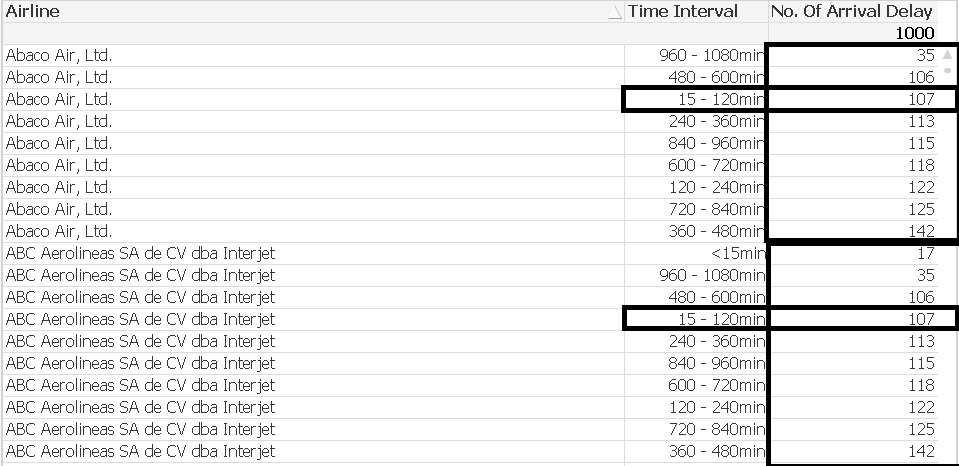
I was trying to achieve the above, as you notice the 2 boxes on the right all total 1000 (in your eg should be 30) and the time interval 15 - 120min is both 107?