Unlock a world of possibilities! Login now and discover the exclusive benefits awaiting you.
- Qlik Community
- :
- All Forums
- :
- QlikView App Dev
- :
- How to group smaller values into a category
- Subscribe to RSS Feed
- Mark Topic as New
- Mark Topic as Read
- Float this Topic for Current User
- Bookmark
- Subscribe
- Mute
- Printer Friendly Page
- Mark as New
- Bookmark
- Subscribe
- Mute
- Subscribe to RSS Feed
- Permalink
- Report Inappropriate Content
How to group smaller values into a category
Hi everyone ,
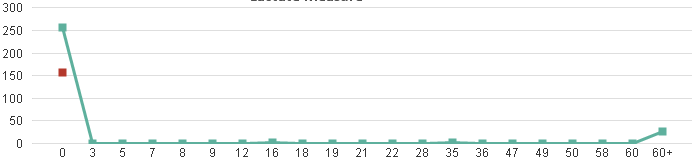
I have a chart where I have a continuous line chart whose data is as follows
min , Value
20 , 50
40, 60
60, 10
80, 1
100,1
120,1
140,1
160,1
.
.
.
.
So it makes very rough line chart what I want is in my linechart there should be values like this
min , Value
20 , 50
40, 60
60, 10
80+, Sum of all values of >60 mins
How is this possible
- Mark as New
- Bookmark
- Subscribe
- Mute
- Subscribe to RSS Feed
- Permalink
- Report Inappropriate Content
load if(min>60,'80+',min) as min, Value
from ...somewhere...;
or as a calculated dimension in your chart, i.e. instead of using min as dimension you use as calculated dimension if(min>60,'80+',min).
talk is cheap, supply exceeds demand
- Mark as New
- Bookmark
- Subscribe
- Mute
- Subscribe to RSS Feed
- Permalink
- Report Inappropriate Content
Thanks it works , Now I want to group these values by a step of 20 i.e. on xaxis labels will show 0,20,40,60,60+
20 will have value of count of all the events which occured between 0 and 20 and 40 will have value of count of all the events which occured between 20 and 40 and can I add min suffix which will make labels like this 20min,40min,60min,60+min ?