Unlock a world of possibilities! Login now and discover the exclusive benefits awaiting you.
- Qlik Community
- :
- All Forums
- :
- QlikView App Dev
- :
- How to hide a Text Object in front of a Chart unti...
- Subscribe to RSS Feed
- Mark Topic as New
- Mark Topic as Read
- Float this Topic for Current User
- Bookmark
- Subscribe
- Mute
- Printer Friendly Page
- Mark as New
- Bookmark
- Subscribe
- Mute
- Subscribe to RSS Feed
- Permalink
- Report Inappropriate Content
How to hide a Text Object in front of a Chart until a field selection is made?
Hi all,
I have the following screenshot:
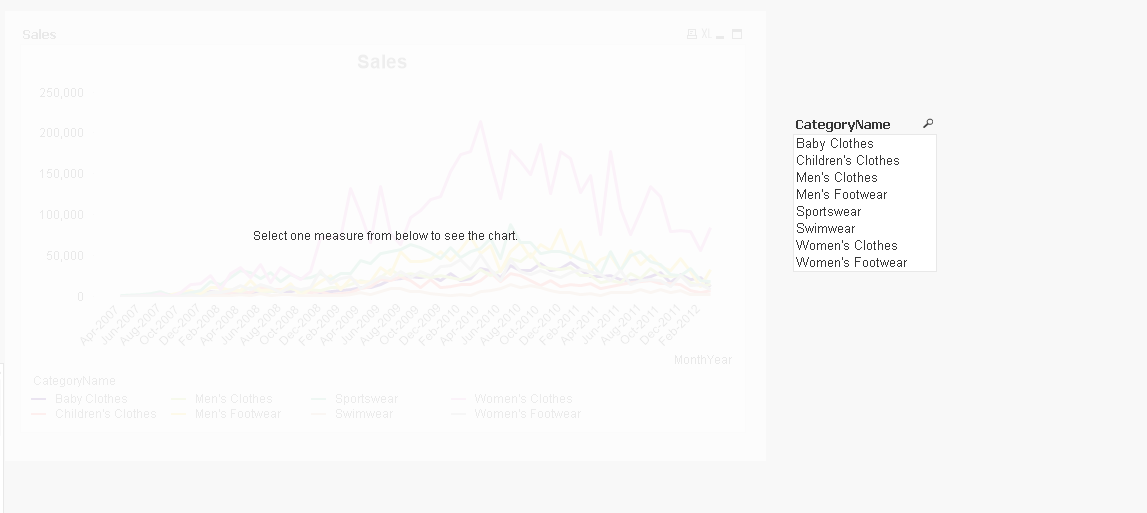
You can see the chart behind the text object.
Using the Grid option I have sent the Chart back and bought the Text Object forward (which has a low gradient).
I would like to hide the text object when someone makes only 1 selection in the CategoryName field and show the chart instead.
So I thought my Show Condition for the Text Object would be: GetFieldSelections(CategoryName)<>1
But this does not work. The chart remains in the background and the text object does not go away.
Does anyone know how to make this technique work please? 
- « Previous Replies
-
- 1
- 2
- Next Replies »
Accepted Solutions
- Mark as New
- Bookmark
- Subscribe
- Mute
- Subscribe to RSS Feed
- Permalink
- Report Inappropriate Content
Can you select Ctrl + Shift + S to see if this helps
- Mark as New
- Bookmark
- Subscribe
- Mute
- Subscribe to RSS Feed
- Permalink
- Report Inappropriate Content
Try
GetSelectedCount() instead of GetFieldSelections()
- Mark as New
- Bookmark
- Subscribe
- Mute
- Subscribe to RSS Feed
- Permalink
- Report Inappropriate Content
May be this:
GetSelectedCount(CategoryName) <> 1
- Mark as New
- Bookmark
- Subscribe
- Mute
- Subscribe to RSS Feed
- Permalink
- Report Inappropriate Content
Hi Stefan and Sunny,
I will use that!
But the text object still shows in front of the chart! Do I need to change any other configurations?
- Mark as New
- Bookmark
- Subscribe
- Mute
- Subscribe to RSS Feed
- Permalink
- Report Inappropriate Content
Hello John,
Under your textbox properties, go to the Layout Tab, click on Show: Conditional and insert either one of the following expressions:
Count(CategoryName) <> Count({1} CategoryName)
or
GetSelectedCount(CategoryName) = 0
Cheers,
Philippe
- Mark as New
- Bookmark
- Subscribe
- Mute
- Subscribe to RSS Feed
- Permalink
- Report Inappropriate Content
Are you sure there is only one text box? May be accidently added more than one text box object and did not delete the extra one. Can you check the conditional show statement on the expression tab for this one that is still showing?
- Mark as New
- Bookmark
- Subscribe
- Mute
- Subscribe to RSS Feed
- Permalink
- Report Inappropriate Content
Hi Sunny,
Yes I checked it there is no other text object in front of the chart.
I did send the chart back and bought the text object forward. Can that affect it?
- Mark as New
- Bookmark
- Subscribe
- Mute
- Subscribe to RSS Feed
- Permalink
- Report Inappropriate Content
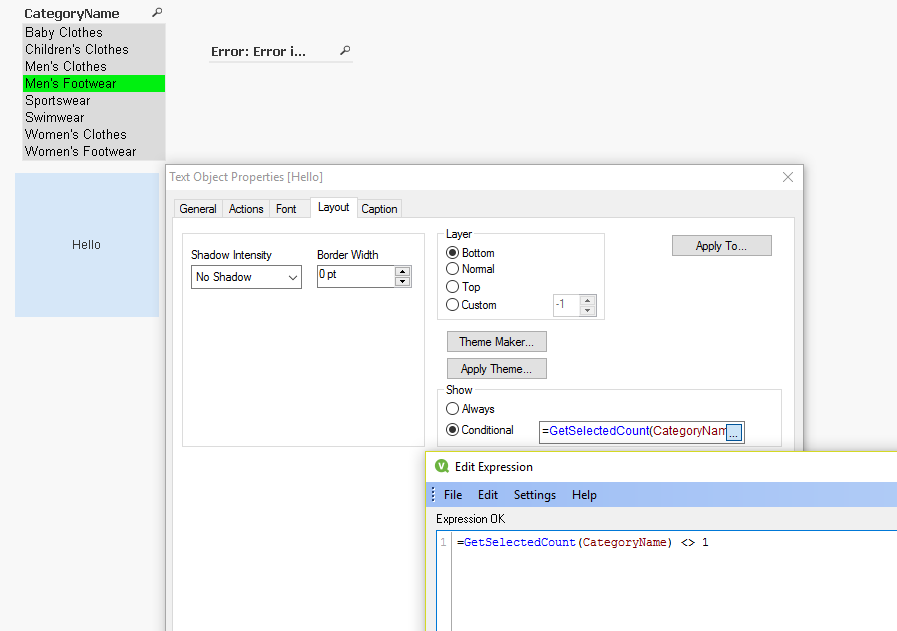
What is the conditional expression for this object on the layout tab? Do you see this or not?
=GetSelectedCount(CategoryName) <> 1
- Mark as New
- Bookmark
- Subscribe
- Mute
- Subscribe to RSS Feed
- Permalink
- Report Inappropriate Content
Hi Sunny,
Yes I even did it with Hello text below:
Do you maybe have a sample app where it works? I can compare then.
- Mark as New
- Bookmark
- Subscribe
- Mute
- Subscribe to RSS Feed
- Permalink
- Report Inappropriate Content
What is
=GetSelectedCount( CategoryName )
returning in a text box?
- « Previous Replies
-
- 1
- 2
- Next Replies »