Unlock a world of possibilities! Login now and discover the exclusive benefits awaiting you.
Announcements
Save $650 on Qlik Connect, Dec 1 - 7, our lowest price of the year. Register with code CYBERWEEK: Register
- Qlik Community
- :
- All Forums
- :
- QlikView App Dev
- :
- How to insert a Max & Average in a chart
Options
- Subscribe to RSS Feed
- Mark Topic as New
- Mark Topic as Read
- Float this Topic for Current User
- Bookmark
- Subscribe
- Mute
- Printer Friendly Page
Turn on suggestions
Auto-suggest helps you quickly narrow down your search results by suggesting possible matches as you type.
Showing results for
Not applicable
2013-06-13
06:03 AM
- Mark as New
- Bookmark
- Subscribe
- Mute
- Subscribe to RSS Feed
- Permalink
- Report Inappropriate Content
How to insert a Max & Average in a chart
Hello,
I have that kind of charts with a products' sales before and after one event (event = week 0) (one curved line = one product)
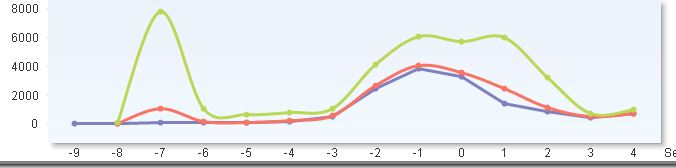
Is there any possibility to insert in that same chart the max or/and the avertage of that products for the selected weeks?
thank u very much for your help
1,767 Views
- « Previous Replies
-
- 1
- 2
- Next Replies »
11 Replies
Not applicable
2013-06-17
12:13 PM
Author
- Mark as New
- Bookmark
- Subscribe
- Mute
- Subscribe to RSS Feed
- Permalink
- Report Inappropriate Content
oh.. and how I could do that?
270 Views
Partner - Creator
2013-06-17
12:56 PM
- Mark as New
- Bookmark
- Subscribe
- Mute
- Subscribe to RSS Feed
- Permalink
- Report Inappropriate Content
See this application. Trigger is in Document Properties / Trigger - Field Event triggers
270 Views
- « Previous Replies
-
- 1
- 2
- Next Replies »