Unlock a world of possibilities! Login now and discover the exclusive benefits awaiting you.
- Qlik Community
- :
- All Forums
- :
- QlikView App Dev
- :
- How to insert a rectangle shape in Scatter chart?
- Subscribe to RSS Feed
- Mark Topic as New
- Mark Topic as Read
- Float this Topic for Current User
- Bookmark
- Subscribe
- Mute
- Printer Friendly Page
- Mark as New
- Bookmark
- Subscribe
- Mute
- Subscribe to RSS Feed
- Permalink
- Report Inappropriate Content
How to insert a rectangle shape in Scatter chart?
Hello,
I am trying to create a scatter chart. I have the layout of a school as the background image. I want to give different colors to the different buildings in the school.
Most of the buildings are rectangular. Any idea how can i change the shape of the circle you get in the scatter chart to a rectangle?
TIA
- Tags:
- scatterchart
- Mark as New
- Bookmark
- Subscribe
- Mute
- Subscribe to RSS Feed
- Permalink
- Report Inappropriate Content
Hi Arjun,
In the scatter chart object, you need to go to
Colors --> frame Background --> image and select the image
Take care to select the transparency to 0% for the image to show up.
thanks,
Rajesh Vaswani
- Mark as New
- Bookmark
- Subscribe
- Mute
- Subscribe to RSS Feed
- Permalink
- Report Inappropriate Content
I am not asking that.
I know how to insert a background image.
I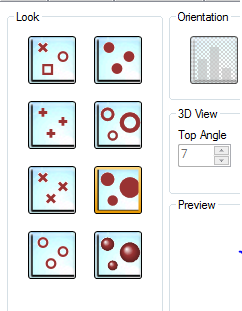
I want to know whether I can insert a rectangular shape instead of the options shown above.
Thanks