Unlock a world of possibilities! Login now and discover the exclusive benefits awaiting you.
- Qlik Community
- :
- All Forums
- :
- QlikView App Dev
- :
- How to insert gif image into chart item?
- Subscribe to RSS Feed
- Mark Topic as New
- Mark Topic as Read
- Float this Topic for Current User
- Bookmark
- Subscribe
- Mute
- Printer Friendly Page
- Mark as New
- Bookmark
- Subscribe
- Mute
- Subscribe to RSS Feed
- Permalink
- Report Inappropriate Content
How to insert gif image into chart item?
Hi,
I have gif image from website. How can i insert this into qlikview chart item?
http://www.picgifs.com/mini-graphics/mini-graphics/balloons/mini-graphics-balloons-556438.gif
Thanks.
- Tags:
- new_to_qlikview
- Mark as New
- Bookmark
- Subscribe
- Mute
- Subscribe to RSS Feed
- Permalink
- Report Inappropriate Content
Am I doing any wrong expression here? please let me know.
- Mark as New
- Bookmark
- Subscribe
- Mute
- Subscribe to RSS Feed
- Permalink
- Report Inappropriate Content
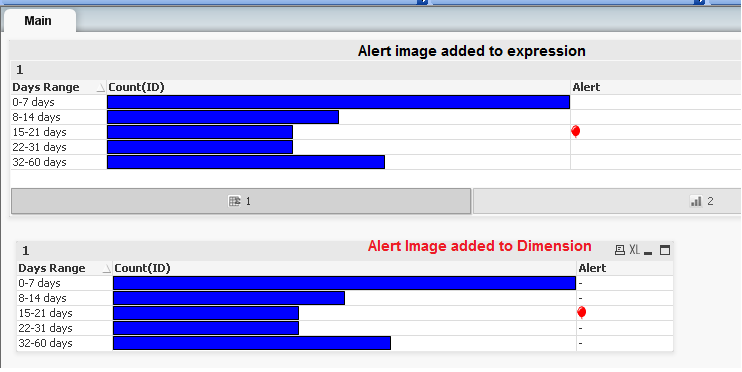
I've attached the QVW once again. I've created another chart in which you will see the alert image in the dimension.
Let me know if you are able to see just one alert image in the charts or not when you open this QVW at your end.
Screenshot from my system shows only one image.
- Mark as New
- Bookmark
- Subscribe
- Mute
- Subscribe to RSS Feed
- Permalink
- Report Inappropriate Content
Thanks. It's really strange for me as I am not getting what is going in my PC and see attached.
- Mark as New
- Bookmark
- Subscribe
- Mute
- Subscribe to RSS Feed
- Permalink
- Report Inappropriate Content
Did you just open the QVW I sent earlier or You created your own QVW and copied the expressions from the attached one I sent earlier?
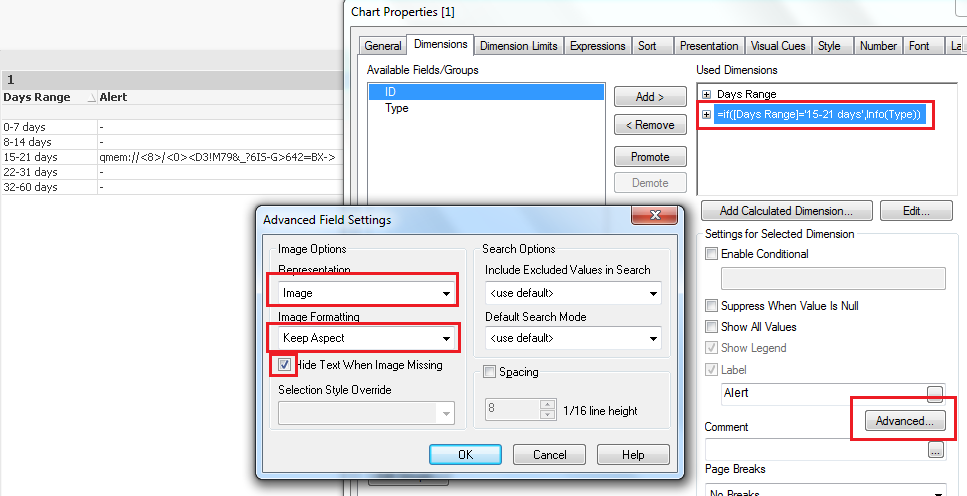
Because in your screenshot I see that the Dimension Alert is before the expression column where as the screenshot I attached shows the dimension column placed after the Expression column (count(ID))
Please let me know.
Also If you have created a new QVW and copied the expressions from the one I sent then please follow the below given steps.
1. Open the QVW I sent earlier, in your system
2. Please send me a full screenshot of the main sheet.
- Mark as New
- Bookmark
- Subscribe
- Mute
- Subscribe to RSS Feed
- Permalink
- Report Inappropriate Content
Please see my attached qvw. I am making changes in this by following your attached ones.
- Mark as New
- Bookmark
- Subscribe
- Mute
- Subscribe to RSS Feed
- Permalink
- Report Inappropriate Content
OK So when you open the QVW I sent, Are you able to see the charts properly?
It seems you have not followed all the properties I set in my version.
Because from your QVW I can see that you need to make some changes in your chart.
Please follow the steps below.
Once the above steps are done then you can drag the dimension column to the extreme right so that it will appear after the expression "Count(ID)".
Let me know if you face any trouble.
- Mark as New
- Bookmark
- Subscribe
- Mute
- Subscribe to RSS Feed
- Permalink
- Report Inappropriate Content
Thanks and that's perfect. How can I hide Days Range column which is in you rscreen shot earlier as attached.
- Mark as New
- Bookmark
- Subscribe
- Mute
- Subscribe to RSS Feed
- Permalink
- Report Inappropriate Content
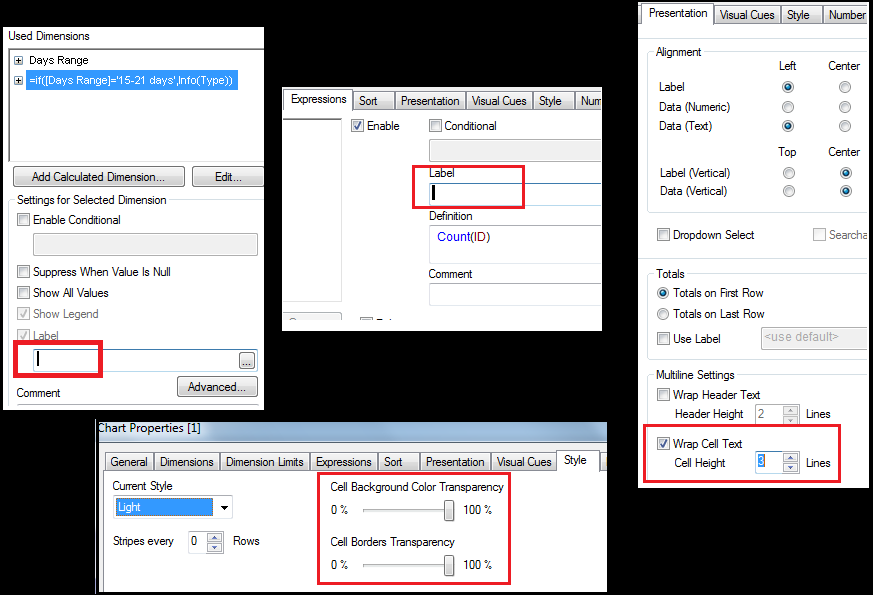
To apply a style like the one I sent please follow these steps.
1. Dimensions Label and Expressions Label as '' just a "space" no text
2. Chart Properties > Style border transparency
3. Chart Properties > Presentation > Wrap Cell Text
4. Hide Caption
Please see the screenshot.
- Mark as New
- Bookmark
- Subscribe
- Mute
- Subscribe to RSS Feed
- Permalink
- Report Inappropriate Content
Thanks . please see attached somehow I am near..
- Mark as New
- Bookmark
- Subscribe
- Mute
- Subscribe to RSS Feed
- Permalink
- Report Inappropriate Content
Change the Dimension and Expression label.
From your screenshot I can still see texts (Days in Range and Count(ID)) in the headers
1. Chart Properties > Dimensions tab > Select the Used Dimension > put a space in Dimension Label
2. Chart Properties > Expressions tab > Select Expression > put a space in the Expression Label
Hope this helps. You can follow the screenshots I sent earlier.