Unlock a world of possibilities! Login now and discover the exclusive benefits awaiting you.
- Qlik Community
- :
- All Forums
- :
- QlikView App Dev
- :
- How to join data when using pivot tables
- Subscribe to RSS Feed
- Mark Topic as New
- Mark Topic as Read
- Float this Topic for Current User
- Bookmark
- Subscribe
- Mute
- Printer Friendly Page
- Mark as New
- Bookmark
- Subscribe
- Mute
- Subscribe to RSS Feed
- Permalink
- Report Inappropriate Content
How to join data when using pivot tables
Hi,
I've been having fun with data I'm trying to work with pivot tables in QV. I'm not clear on what a good approach to tackle the issue is - i.e. one that won't trip me up further down the road when I try compare last year to this year, etc and eventually alternate states.
To illustrate I've simplified things but lets say I have data like this for 2011 and 2012, and want to group sum data by different dimensions - both date and product groups.
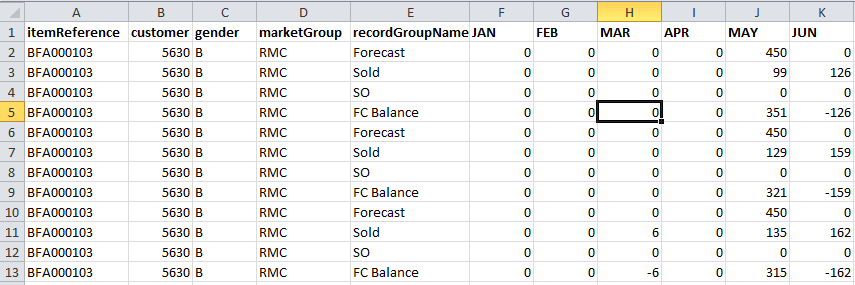
As a spreadsheet data looks like this:

itemReference is the detail and then customer gender and marketGroup are groupings of itemReference.
Complication (for me) is recordGroupName which as you see is this data's way of representing a Forecast for Jan-Dec, a Sold value for Jan-Dec, a SO value for Jan -Dec and a FCBalance value for Jan-Dec in the spreadsheet.
To get the monthly data into a columnar pivottable format I first did this but here I only get forecast data visible. I'm using simple Sum(forecast) or Sum(So) type expressions. There are no synthetic keys though.
[Forecast2011]:
CrossTable(MonthName, Forecast, 5)
LOAD itemReference,
customer, gender, marketGroup, recordGroupName,
JAN, FEB, MAR, APR, MAY, JUN, JUL,
AUG, SEP, OCT, NOV, DEC
FROM
(biff, embedded labels, table is [demand enquiry jan - dec 2011 w$]);
gets to this

I thought of using set analysis to spearate data into Forecast, Sold and SO (I suspect this should work but am unsure if I'm creating later difficulties for myself using this approach to manipulate the data given the end result I'm building toward) but then went off to try get the data into am easier to manage from the start format using scripting by loading the pivot 3 times but restricting the LOAD by each recordGroupName field value. i.e. this. I'm using a simple autogenerated calendar to start with, then I get to the pivot table script:
LET vDateMin = Num(MakeDate(2009,1,1));
LET vDateMax = Num(MakeDate(2012,12,31));
LET vDateToday = Num(Today());
[TempCalendar]:
LOAD
$(vDateMin) + RowNo() - 1 AS DateNumber,
Date($(vDateMin) + RowNo() - 1) AS TempDate
AUTOGENERATE 1
WHILE $(vDateMin)+IterNo()-1<= $(vDateMax);
[Calendar]:
LOAD
Month(TempDate) AS MonthName
RESIDENT TempCalendar ORDER BY TempDate ASC;
DROP TABLE TempCalendar;
[Forecast2011]:
CrossTable(MonthName, Forecast, 5)
LOAD itemReference,
customer, gender, marketGroup, recordGroupName,
JAN, FEB, MAR, APR, MAY, JUN, JUL,
AUG, SEP, OCT, NOV, DEC
FROM
(biff, embedded labels, table is [demand enquiry jan - dec 2011 w$])
WHERE recordGroupName = 'Forecast';
[SO2011]:
CrossTable(MonthName, SO, 5)
LOAD itemReference,
customer, gender, marketGroup, recordGroupName,
JAN, FEB, MAR, APR, MAY, JUN, JUL,
AUG, SEP, OCT, NOV, DEC
FROM
(biff, embedded labels, table is [demand enquiry jan - dec 2011 w$])
WHERE recordGroupName = 'SO';
[Sold2011]:
CrossTable(MonthName, Sold, 5)
LOAD itemReference,
customer, gender, marketGroup, recordGroupName,
JAN, FEB, MAR, APR, MAY, JUN, JUL,
AUG, SEP, OCT, NOV, DEC
FROM
(biff, embedded labels, table is [demand enquiry jan - dec 2011 w$])
WHERE recordGroupName = 'Sold';
This works since I get this

but then I also get a synthetic key maze. I tried JOIN on the 3 pivot table script but it seems I cannot do this with without syntax errors so am guessing this is not supported - i.e. joining pivot tables in a script.

How can I tackle this better? Ideally I want a single pivot table output for charting/drilldown/aggregation. I'd also like to avoid the synthetic keys if I can. And then have data in a format that would support lastyear to thisyear comparison and (ultimately) alternate states comparisons.
- Mark as New
- Bookmark
- Subscribe
- Mute
- Subscribe to RSS Feed
- Permalink
- Report Inappropriate Content
I tried set analysis on the single pivot table approach I initially tried above. i.e. in theory this table should contain values of Forecast for Jan-Dec, a Sold value for Jan-Dec, a SO value for Jan -Dec and a FCBalance value for Jan-Dec just not as discrete columns.
I wrote a set expression for Forecast, SO and Sold. However, they all return the same values so are clearly not aggregating the loaded data by the specified set, so either my input data is incorrectly scripted to achieve this set analysis or my set syntax is wrong.
I just tried using the ffg respective expressions
Sum({$<recordGroupName={'Forecast'}>}Forecast)
Sum({$<recordGroupName={'SO'}>}Forecast)
Sum({$<recordGroupName={'Sold'}>}Forecast)
I'm now thinking possibly I need to possibly transpose the pivot data first and then ...