Unlock a world of possibilities! Login now and discover the exclusive benefits awaiting you.
- Qlik Community
- :
- All Forums
- :
- QlikView App Dev
- :
- Re: How to limit values of list box
- Subscribe to RSS Feed
- Mark Topic as New
- Mark Topic as Read
- Float this Topic for Current User
- Bookmark
- Subscribe
- Mute
- Printer Friendly Page
- Mark as New
- Bookmark
- Subscribe
- Mute
- Subscribe to RSS Feed
- Permalink
- Report Inappropriate Content
How to limit values of list box
Hi All,
I have 3 values for REGION column. Let values are A,B,C and corresponding sub-regions for 3 regions.in dashboard
I need to display only region A in list box of REGION and corresponding sub-regions of A in Sub-region filter list box.
how I should write a calculated dimension to display only A in REGION filter(listbox) and corresponding Sub-region of A in Sub-region
filter(list box).
Thanks in advance......
- « Previous Replies
-
- 1
- 2
- Next Replies »
- Mark as New
- Bookmark
- Subscribe
- Mute
- Subscribe to RSS Feed
- Permalink
- Report Inappropriate Content
I know this is why you use set analysis with Region = 'A' but you display the subregion just try out the formular.
only({<Region = {'A'}>}SubRegion)
reagards
- Mark as New
- Bookmark
- Subscribe
- Mute
- Subscribe to RSS Feed
- Permalink
- Report Inappropriate Content
its not working....
even I select ' A',I am not getting any values
- Mark as New
- Bookmark
- Subscribe
- Mute
- Subscribe to RSS Feed
- Permalink
- Report Inappropriate Content
I have written this formula
=aggr(only( {<SUB_REGION_NM=P({<Region={'A'}>} SUB_REGION_NM)>}SUB_REGION_NM),SUB_REGION_NM)
but I am getting all subregions of all regions.
- Mark as New
- Bookmark
- Subscribe
- Mute
- Subscribe to RSS Feed
- Permalink
- Report Inappropriate Content
how are subregion and region linked and are they linked in you datamodel?
- Mark as New
- Bookmark
- Subscribe
- Mute
- Subscribe to RSS Feed
- Permalink
- Report Inappropriate Content
region and sub-region are from same table
- Mark as New
- Bookmark
- Subscribe
- Mute
- Subscribe to RSS Feed
- Permalink
- Report Inappropriate Content
Enable the below option in List box properties.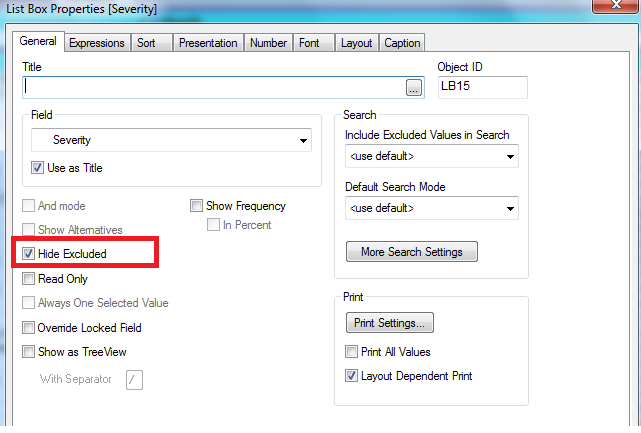
This might help u .
Thanks!
D J
- « Previous Replies
-
- 1
- 2
- Next Replies »