Unlock a world of possibilities! Login now and discover the exclusive benefits awaiting you.
- Qlik Community
- :
- All Forums
- :
- QlikView App Dev
- :
- Re: How to line up Text on axis with bars in chart
- Subscribe to RSS Feed
- Mark Topic as New
- Mark Topic as Read
- Float this Topic for Current User
- Bookmark
- Subscribe
- Mute
- Printer Friendly Page
- Mark as New
- Bookmark
- Subscribe
- Mute
- Subscribe to RSS Feed
- Permalink
- Report Inappropriate Content
How to line up Text on axis with bars in chart
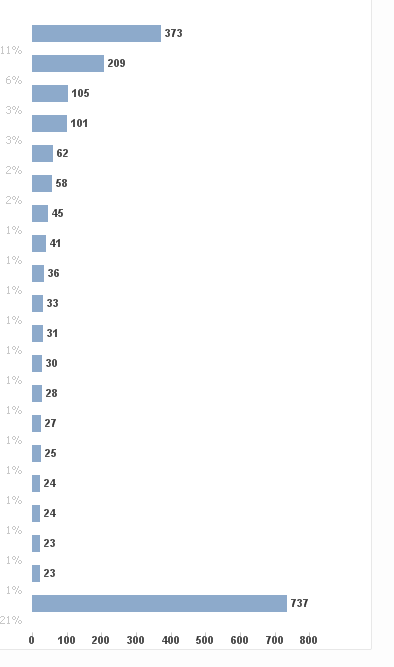
How can i get my text on axis values to line u with the bars in the chart?
The cart has 2 expressions with one bar hidden (the one that has the text on the axis)
can i align this with the first expression?
CURRENT
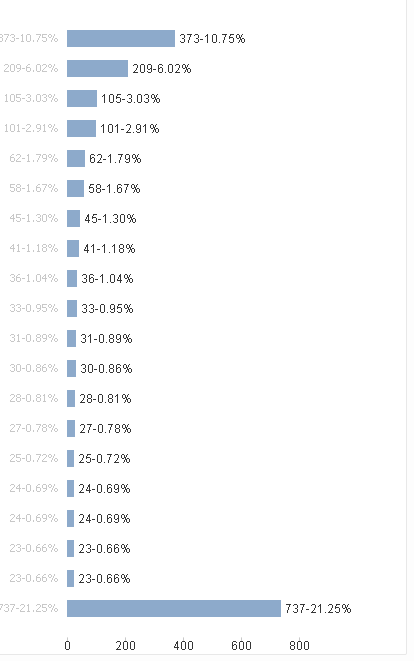
WHAT I WANT

- Tags:
- bar
- chart
- text on axis
- « Previous Replies
-
- 1
- 2
- Next Replies »
- Mark as New
- Bookmark
- Subscribe
- Mute
- Subscribe to RSS Feed
- Permalink
- Report Inappropriate Content
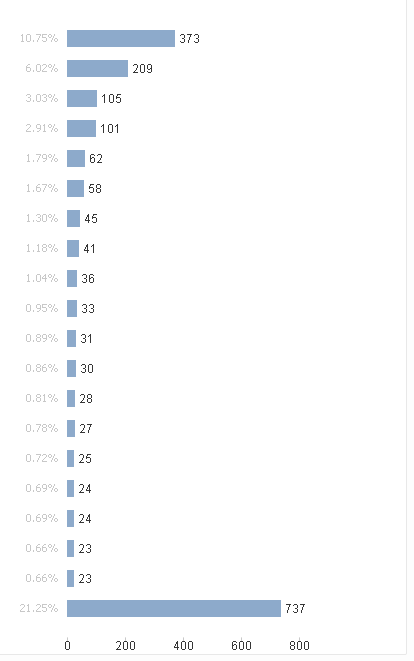
Write the single Expression:
=Dual( COUNT(DISTINCT S_ID) &'-'& num((COUNT(DISTINCT S_ID)/COUNT(DISTINCT TOTAL S_ID)),'#0.00%'),
COUNT(DISTINCT S_ID))
Check the Value on Data point
- Mark as New
- Bookmark
- Subscribe
- Mute
- Subscribe to RSS Feed
- Permalink
- Report Inappropriate Content
use calculated dimension with COUNT(DISTINCT S_ID)/COUNT(DISTINCT TOTAL S_ID)
and your expresion will be COUNT(DISTINCT S_ID)
- Mark as New
- Bookmark
- Subscribe
- Mute
- Subscribe to RSS Feed
- Permalink
- Report Inappropriate Content
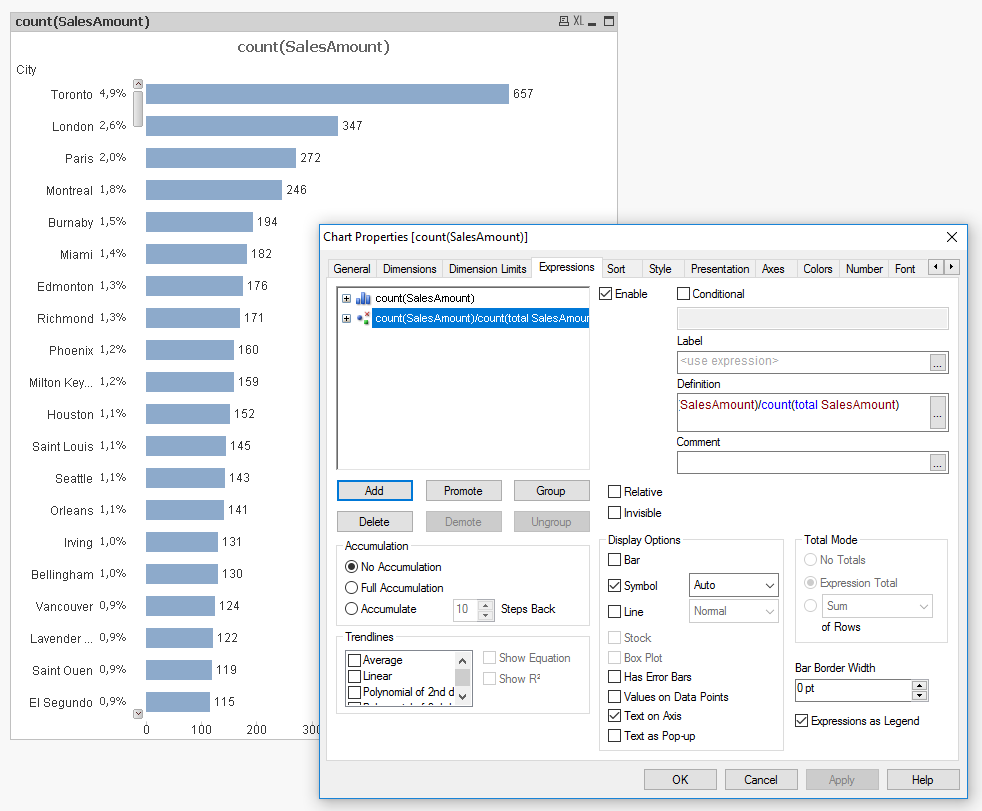
If you have two expressions then the text-on-axis will be aligned with its own expression, not the other one. But perhaps you can use a combi chart and use Symbol as representation type for the second expression and set the background color of the symbol to a totally transparent color like red(0).
talk is cheap, supply exceeds demand
- Mark as New
- Bookmark
- Subscribe
- Mute
- Subscribe to RSS Feed
- Permalink
- Report Inappropriate Content
This is giving me both values on each point
i want % on axis and total on data point
- Mark as New
- Bookmark
- Subscribe
- Mute
- Subscribe to RSS Feed
- Permalink
- Report Inappropriate Content
If you have Text on axis expression then just click on + sign and Give text color expression as Black() or red()
- Mark as New
- Bookmark
- Subscribe
- Mute
- Subscribe to RSS Feed
- Permalink
- Report Inappropriate Content
I mean i want it to look like this...
- Mark as New
- Bookmark
- Subscribe
- Mute
- Subscribe to RSS Feed
- Permalink
- Report Inappropriate Content
See attached example.
talk is cheap, supply exceeds demand
- Mark as New
- Bookmark
- Subscribe
- Mute
- Subscribe to RSS Feed
- Permalink
- Report Inappropriate Content

- Mark as New
- Bookmark
- Subscribe
- Mute
- Subscribe to RSS Feed
- Permalink
- Report Inappropriate Content
I'm using the personal edition and am unable to view this file. Can the solution be explained?
- Mark as New
- Bookmark
- Subscribe
- Mute
- Subscribe to RSS Feed
- Permalink
- Report Inappropriate Content
Perhaps this helps:
talk is cheap, supply exceeds demand
- « Previous Replies
-
- 1
- 2
- Next Replies »