Unlock a world of possibilities! Login now and discover the exclusive benefits awaiting you.
- Qlik Community
- :
- All Forums
- :
- QlikView App Dev
- :
- How to make a chart showing the calculated percent...
- Subscribe to RSS Feed
- Mark Topic as New
- Mark Topic as Read
- Float this Topic for Current User
- Bookmark
- Subscribe
- Mute
- Printer Friendly Page
- Mark as New
- Bookmark
- Subscribe
- Mute
- Subscribe to RSS Feed
- Permalink
- Report Inappropriate Content
How to make a chart showing the calculated percentage point difference between two periods?
Hi
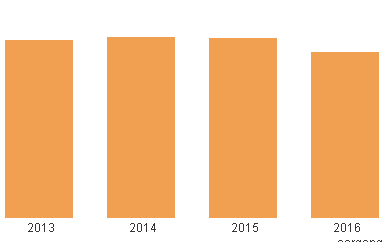
I have made a bar chart showing the percentage of the student mass, who are foreign students.
I have data from 2013-2016 so far. Every year new data is added.
The chart looks like this, with percentage on the y-axis:
the code I used looks like this:
=num(count({<over_udd={'Bachelor', 'Kandidat'},[Hjemland2]={'Udenlandsk'}>}PERSON_ID)/(sum({<over_udd={'Bachelor', 'Kandidat'}>}bestand_antal)))
Now I would like to make a bar chart showing the percentage point difference from one year to the next.
I thought it would be smart to make the code dynamic, so I don't have to maintain it, every time a new year is added.
I have tried the folowwing code, but it does not work:
=num(count({<over_udd={'Bachelor', 'Kandidat'},[Hjemland2]={'Udenlandsk'}>}PERSON_ID)/(sum({<over_udd={'Bachelor', 'Kandidat'}>}bestand_antal)))
- num(count({<over_udd={'Bachelor', 'Kandidat'},[Hjemland2]={'Udenlandsk'}, [Aargang]={Aargang}-1>}PERSON_ID) /(sum({<over_udd={'Bachelor', 'Kandidat'},[Aargang]={(Aargang}-1>}bestand_antal)))
The first part is just a copy of the old code, whick shows the percentage number every year. So I thought that I could just copy it, and add a "go one year back and compare" statement (year=Aargang). But it says error in expression.
How do I tell QV to compare the percentage from one year with the year before?
I know that there will be no data in 2013, because it is the first year.
I have made a vMinAargang and a vMaxAargang variable, but I haven't used them (yet).
Kind regards
Maria
Accepted Solutions
- Mark as New
- Bookmark
- Subscribe
- Mute
- Subscribe to RSS Feed
- Permalink
- Report Inappropriate Content
Hi Maria,
Have a look at Above() function. Something like:
num(count({<over_udd={'Bachelor', 'Kandidat'},[Hjemland2]={'Udenlandsk'}>}PERSON_ID)/(sum({<over_udd={'Bachelor', 'Kandidat'}>}bestand_antal)))
-
Above(num(count({<over_udd={'Bachelor', 'Kandidat'},[Hjemland2]={'Udenlandsk'}>}PERSON_ID)/(sum({<over_udd={'Bachelor', 'Kandidat'}>}bestand_antal))))
- Mark as New
- Bookmark
- Subscribe
- Mute
- Subscribe to RSS Feed
- Permalink
- Report Inappropriate Content
Hi David
This is exactly what I wanted! Thanks!
I tried to add '###0%' to get the data shown in I percentage.
QV says "expression ok", but the data disappears when I click ok??
This is what I wrote:
=num(count({<over_udd={'Bachelor', 'Kandidat'},[Hjemland2]={'Udenlandsk'}>}PERSON_ID)/(sum({<over_udd={'Bachelor', 'Kandidat'}>}bestand_antal)),'###0%') -
Above(num(count({<over_udd={'Bachelor', 'Kandidat'},[Hjemland2]={'Udenlandsk'}>}PERSON_ID)/(sum({<over_udd={'Bachelor', 'Kandidat'}>}bestand_antal))),'###0%')
Do you know why it doesn't work?
- Mark as New
- Bookmark
- Subscribe
- Mute
- Subscribe to RSS Feed
- Permalink
- Report Inappropriate Content
Hi Maria,
There is a typo in the the expression with num()
This should work:
(
count({<over_udd={'Bachelor', 'Kandidat'},[Hjemland2]={'Udenlandsk'}>}PERSON_ID)/
sum({<over_udd={'Bachelor', 'Kandidat'}>}bestand_antal)
) -
Above(
count({<over_udd={'Bachelor', 'Kandidat'},[Hjemland2]={'Udenlandsk'}>}PERSON_ID)
/sum({<over_udd={'Bachelor', 'Kandidat'}>}bestand_antal)))
)
You can format the number to percentage in the chart properties:
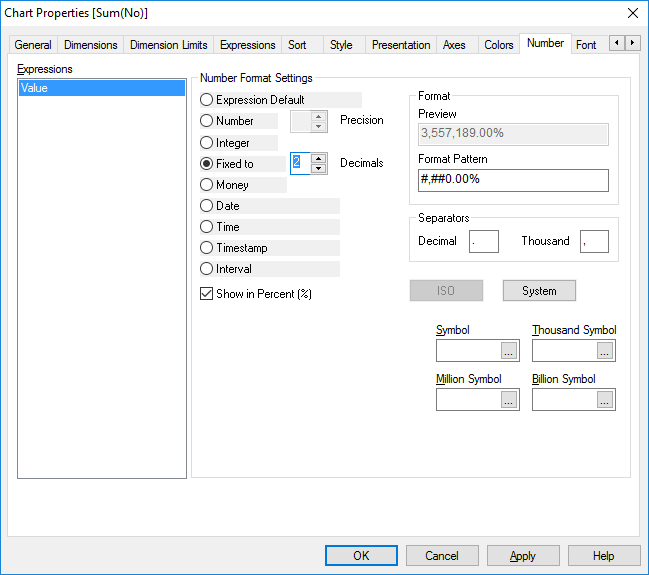
Regards,
David
- Mark as New
- Bookmark
- Subscribe
- Mute
- Subscribe to RSS Feed
- Permalink
- Report Inappropriate Content
Yes it does - thanks 