Unlock a world of possibilities! Login now and discover the exclusive benefits awaiting you.
- Qlik Community
- :
- All Forums
- :
- QlikView App Dev
- :
- How to make a scatter chart for time vs events?
- Subscribe to RSS Feed
- Mark Topic as New
- Mark Topic as Read
- Float this Topic for Current User
- Bookmark
- Subscribe
- Mute
- Printer Friendly Page
- Mark as New
- Bookmark
- Subscribe
- Mute
- Subscribe to RSS Feed
- Permalink
- Report Inappropriate Content
How to make a scatter chart for time vs events?
Hi,
I have a database in the following format:
| ID | AbsoluteTimestamp | RelativeTime | Event | EventID |
|---|---|---|---|---|
| 1 | 15th Aug 2015 18:23:25..000 | 0 | Event A | 1 |
| 2 | 15th Aug 2015 18:23:26.000 | 1 | Event B | 2 |
| 3 | 15th Aug 2015 18:23:27.000 | 2 | Event C | 3 |
| 4 | 15th Aug 2015 18:23:28.000 | 3 | Event A | 1 |
| 5 | 15th Aug 2015 18:23:29.000 | 4 | Event D | 4 |
I want to draw a scatter chart that shows occurence of all events with respect to time.
So on X axis I want to have relative time and on Y axis I want to have EventID or Event names.
The problem lies when I try to show events which have multiple entries at some point of time.
Eg: In this example its Event A that is repeated at time 0 and time 3.
The scatter chart doesn't show this event A and more like this events which have multiple entries at different point of time at all.
Please suggest how should I proceed in generating such event vs time chart. I want to show all the events with respect to time.
Also each Event type (Event with same name and ID) should be shown in same color symbol/bubble.
Thanks in advance for any help and suggestions!
Accepted Solutions
- Mark as New
- Bookmark
- Subscribe
- Mute
- Subscribe to RSS Feed
- Permalink
- Report Inappropriate Content
Maybe like attached?
- Mark as New
- Bookmark
- Subscribe
- Mute
- Subscribe to RSS Feed
- Permalink
- Report Inappropriate Content
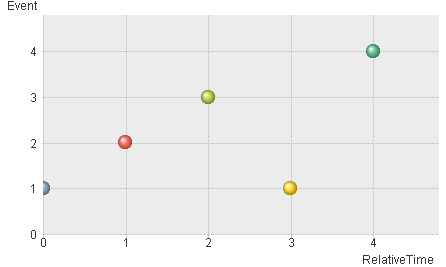
Works OK for me:

Is that what you are after?
With Advance mode check box cleared:
X Relative Time
Y EventID
- Mark as New
- Bookmark
- Subscribe
- Mute
- Subscribe to RSS Feed
- Permalink
- Report Inappropriate Content
Hi Jonathan,
Is it possible to show event at RelativeTime 0 and 3 in same color as both points indicate same event?
Thanks for the quick response! ![]()
- Mark as New
- Bookmark
- Subscribe
- Mute
- Subscribe to RSS Feed
- Permalink
- Report Inappropriate Content
Maybe like attached?
- Mark as New
- Bookmark
- Subscribe
- Mute
- Subscribe to RSS Feed
- Permalink
- Report Inappropriate Content
Hi Swuehl,
I could not understand your point?
Do you want me to upload a sample ".qvf"?
- Mark as New
- Bookmark
- Subscribe
- Mute
- Subscribe to RSS Feed
- Permalink
- Report Inappropriate Content
Have a look at my sample qvw that I've attached to my previous post.
- Mark as New
- Bookmark
- Subscribe
- Mute
- Subscribe to RSS Feed
- Permalink
- Report Inappropriate Content
This is the perfect solution.
I didn't know about the dual functionality of QlikView.
Thanks a lot Swuehl ![]()
- Mark as New
- Bookmark
- Subscribe
- Mute
- Subscribe to RSS Feed
- Permalink
- Report Inappropriate Content
Dear Swuehl,
In the chart you provided I checked if we show legends then the Events are duplicated.
Is there any solution to that?
