Unlock a world of possibilities! Login now and discover the exclusive benefits awaiting you.
Announcements
Qlik Open Lakehouse is Now Generally Available! Discover the key highlights and partner resources here.
- Qlik Community
- :
- All Forums
- :
- QlikView App Dev
- :
- Re: How to make line chart include all values in d...
Options
- Subscribe to RSS Feed
- Mark Topic as New
- Mark Topic as Read
- Float this Topic for Current User
- Bookmark
- Subscribe
- Mute
- Printer Friendly Page
Turn on suggestions
Auto-suggest helps you quickly narrow down your search results by suggesting possible matches as you type.
Showing results for
Not applicable
2012-05-08
01:38 PM
- Mark as New
- Bookmark
- Subscribe
- Mute
- Subscribe to RSS Feed
- Permalink
- Report Inappropriate Content
How to make line chart include all values in dimension
Hi community,
Currently, to see all values In a dimension with a hundred values, I have to enable a scroll bar on the presentation tab.
This puts a scroll bar on the x-axis. Is there any way to change the stepsize on the axis or something like that so I can show the start and finish values at least? I don't need to see all 100 points.
If that's not possible can I at least default the scroll bar to start at the far right of the graph?
655 Views
1 Reply
Not applicable
2012-05-08
03:13 PM
Author
- Mark as New
- Bookmark
- Subscribe
- Mute
- Subscribe to RSS Feed
- Permalink
- Report Inappropriate Content
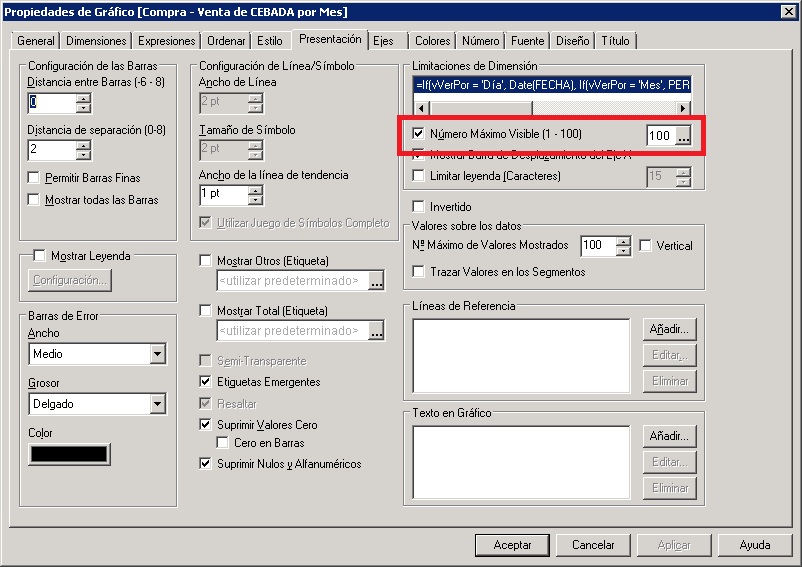
I think changing the value shown in the image can achieve what you want.
In the presentation tab, the option is called Maximum Number Visible
Hope this help you. Regards.-