Unlock a world of possibilities! Login now and discover the exclusive benefits awaiting you.
- Qlik Community
- :
- All Forums
- :
- QlikView App Dev
- :
- Re: How to make my pivot only display total amount...
- Subscribe to RSS Feed
- Mark Topic as New
- Mark Topic as Read
- Float this Topic for Current User
- Bookmark
- Subscribe
- Mute
- Printer Friendly Page
- Mark as New
- Bookmark
- Subscribe
- Mute
- Subscribe to RSS Feed
- Permalink
- Report Inappropriate Content
How to make my pivot only display total amount ?
Hi All
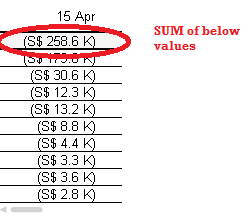
May i know how to make the Table 1 , Now is display all the expense items . i need it display only the total amount , so that i can convert the table into line chart to view trend by month.
Meaning the table only have one row , so that i can change to line chart.
in my next post i will attach the QV Doc.
Paul
- Tags:
- qlikview_scripting
- Mark as New
- Bookmark
- Subscribe
- Mute
- Subscribe to RSS Feed
- Permalink
- Report Inappropriate Content
Enclosed my QV Doc
- Mark as New
- Bookmark
- Subscribe
- Mute
- Subscribe to RSS Feed
- Permalink
- Report Inappropriate Content
Leave your dimension empty...
- Mark as New
- Bookmark
- Subscribe
- Mute
- Subscribe to RSS Feed
- Permalink
- Report Inappropriate Content
Remove
=if(Seq>1 and EXP_P='Y' AND len(Trim($(ColumnDim8)))>1,$(ColumnDim8) & ' ' )
from dimension
- Mark as New
- Bookmark
- Subscribe
- Mute
- Subscribe to RSS Feed
- Permalink
- Report Inappropriate Content
Hi Vinod
After i remove dimension , it only display 1 row , but the total amount changes , the total amount wrong.
Paul
- Mark as New
- Bookmark
- Subscribe
- Mute
- Subscribe to RSS Feed
- Permalink
- Report Inappropriate Content
Hi Paul,
I examined the code and found that your expression is an average, means, you are dividing Amount with $(ColumnDim98). So, when remove the first dimension from the table. it just do the average for the yearmonth but in earlier case it was doing sum