Unlock a world of possibilities! Login now and discover the exclusive benefits awaiting you.
- Qlik Community
- :
- All Forums
- :
- QlikView App Dev
- :
- Re: How to make the state names visible in svg rea...
- Subscribe to RSS Feed
- Mark Topic as New
- Mark Topic as Read
- Float this Topic for Current User
- Bookmark
- Subscribe
- Mute
- Printer Friendly Page
- Mark as New
- Bookmark
- Subscribe
- Mute
- Subscribe to RSS Feed
- Permalink
- Report Inappropriate Content
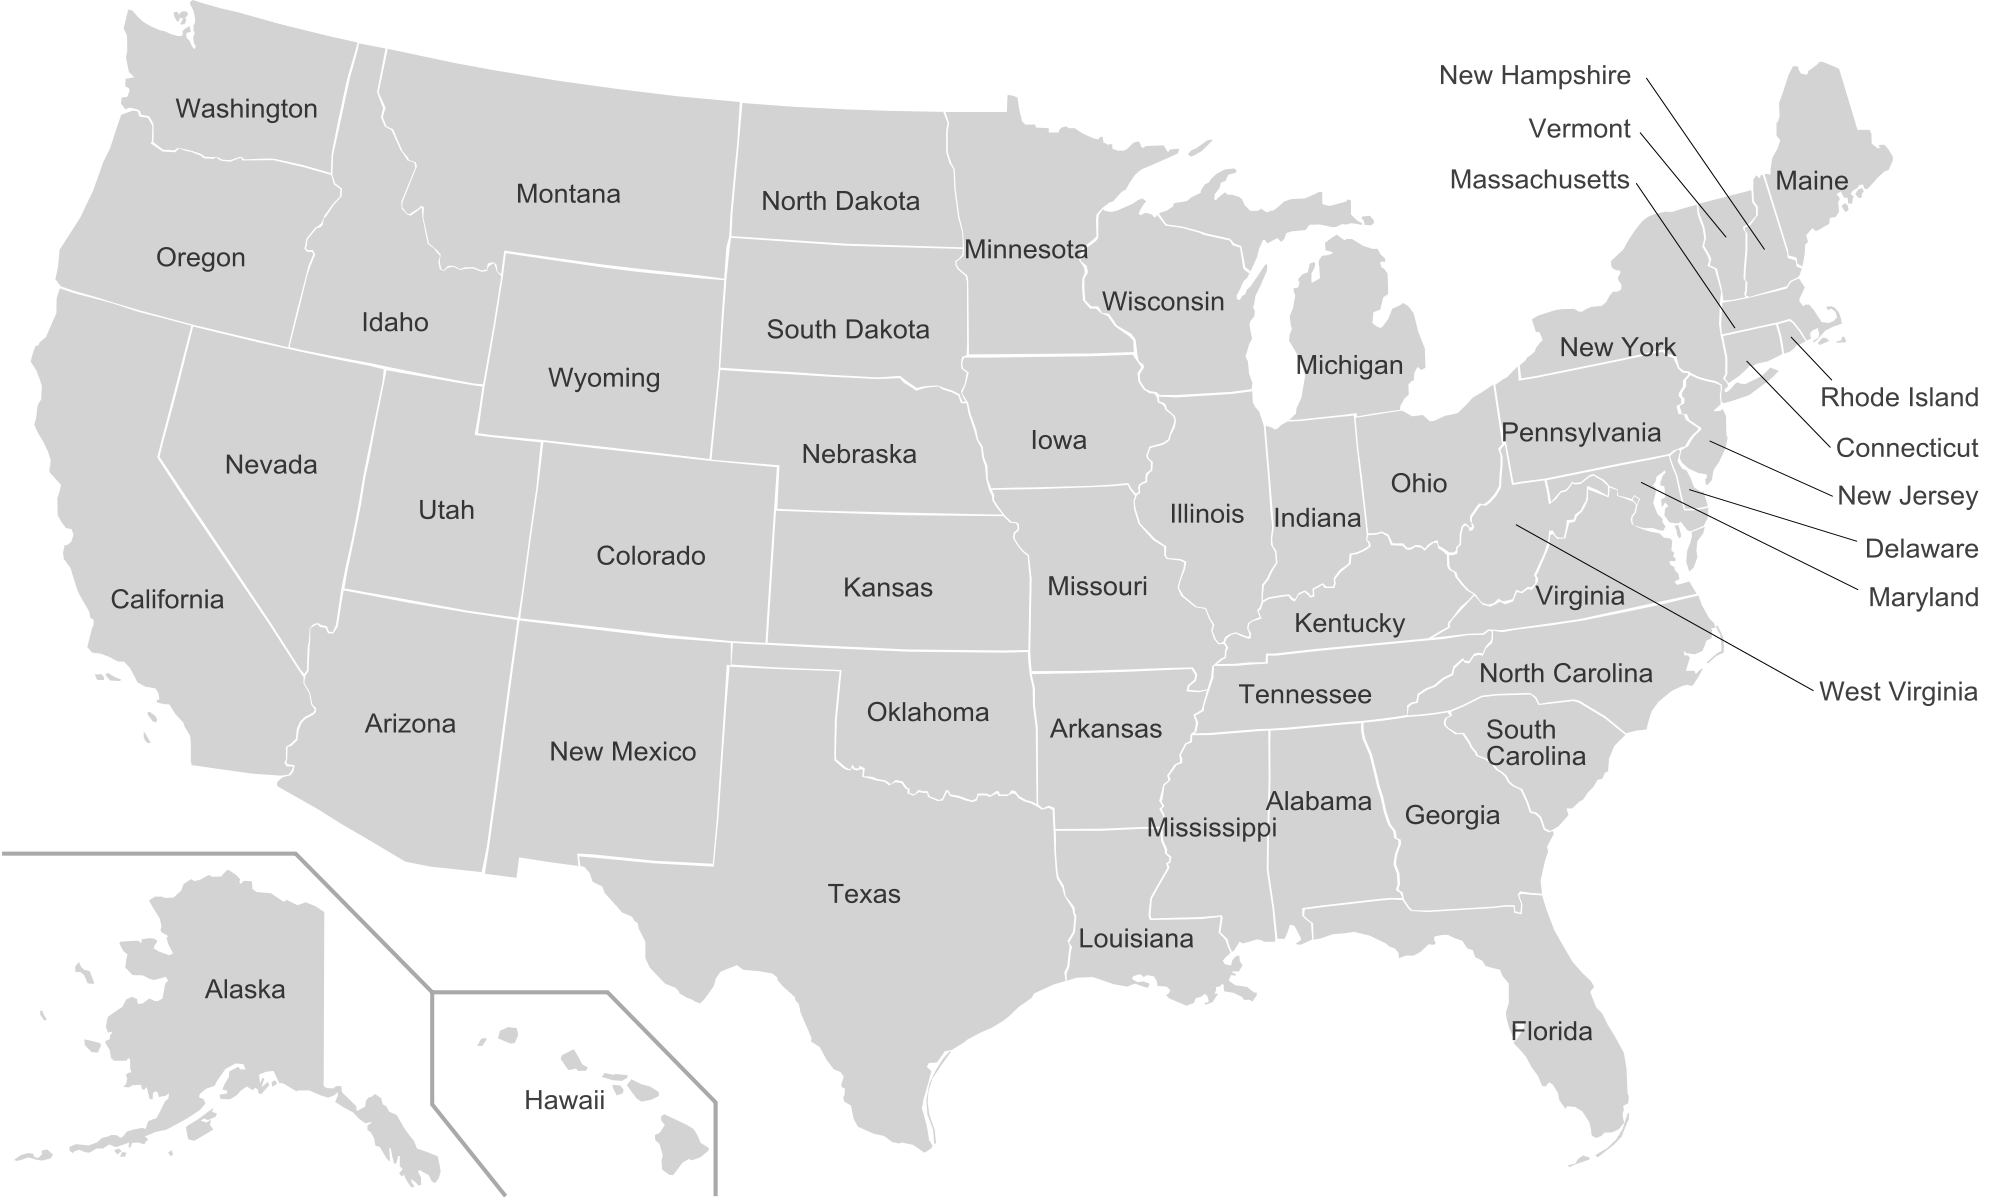
How to make the state names visible in svg reader?
Hi,
I created this map in SVG and now trying to bring the state names visible.
Can some please help me.
I want the results as below..
The names for states which are coloured(like green and red) in my example attachment is enough.
Thanking you in advance.
Accepted Solutions
- Mark as New
- Bookmark
- Subscribe
- Mute
- Subscribe to RSS Feed
- Permalink
- Report Inappropriate Content
!
I have found the found the answer to it. Just download the download the zip file from this link https://community.qlik.com/thread/231076 and extract it. Replace "svgmap" folder in your Qliktech->Qlikview->extensions->objects->svgmap with the "svgmap" folder in the zip file.
after that in the SVGreader load path give "USName2.svg" which is preloaded in that svgmap folder in zip file.
Thats it.
!
- Mark as New
- Bookmark
- Subscribe
- Mute
- Subscribe to RSS Feed
- Permalink
- Report Inappropriate Content
Do you mean you want to show State names on data points for your SVG?
- Mark as New
- Bookmark
- Subscribe
- Mute
- Subscribe to RSS Feed
- Permalink
- Report Inappropriate Content
ya exactly
- Mark as New
- Bookmark
- Subscribe
- Mute
- Subscribe to RSS Feed
- Permalink
- Report Inappropriate Content
!
I have found the found the answer to it. Just download the download the zip file from this link https://community.qlik.com/thread/231076 and extract it. Replace "svgmap" folder in your Qliktech->Qlikview->extensions->objects->svgmap with the "svgmap" folder in the zip file.
after that in the SVGreader load path give "USName2.svg" which is preloaded in that svgmap folder in zip file.
Thats it.
!