Unlock a world of possibilities! Login now and discover the exclusive benefits awaiting you.
- Qlik Community
- :
- All Forums
- :
- QlikView App Dev
- :
- Re: How to obtain a sum of averages of a group of ...
- Subscribe to RSS Feed
- Mark Topic as New
- Mark Topic as Read
- Float this Topic for Current User
- Bookmark
- Subscribe
- Mute
- Printer Friendly Page
- Mark as New
- Bookmark
- Subscribe
- Mute
- Subscribe to RSS Feed
- Permalink
- Report Inappropriate Content
How to obtain a sum of averages of a group of different types of items
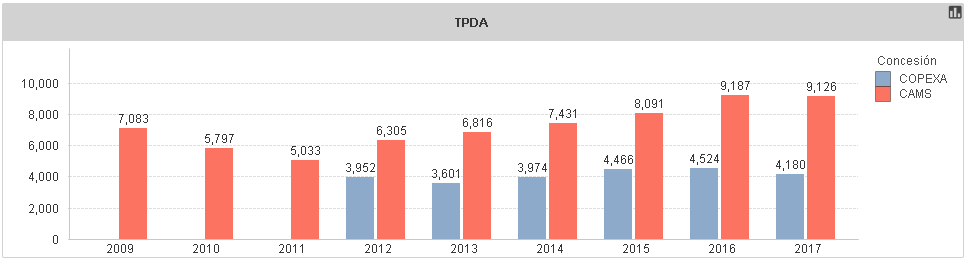
I have a bar chart with two dimensions (Year and Concession), in the expression i need the sum of the average of each type of vehicles (Autos, Buses, CU and CA), but if i use the next expression what i have is the average of all type of vehicles.-
=avg(TPDA)
| Type of Vehicle | 2012 | 2013 | 2014 | 2015 | 2016 | 2017 |
| Autos | 3,248 | 2,631 | 2,818 | 3,213 | 3,243 | 2,912 |
| Buses | 215 | 224 | 282 | 294 | 304 | 280 |
| CU | 218 | 215 | 224 | 256 | 285 | 274 |
| CA | 271 | 531 | 650 | 703 | 692 | 714 |
| Average | 988 | 900 | 993 | 1,116 | 1,131 | 1,045 |
I can use this.-
=avg({<Categoria={'Autos'}>} TPDA)+avg({<Categoria={'Buses'}>} TPDA)+avg({<Categoria={'CU'}>} TPDA)+avg({<Categoria={'CA'}>} TPDA)
| Type of Vehicle | 2012 | 2013 | 2014 | 2015 | 2016 | 2017 |
| Autos | 3,248 | 2,631 | 2,818 | 3,213 | 3,243 | 2,912 |
| Buses | 215 | 224 | 282 | 294 | 304 | 280 |
| CU | 218 | 215 | 224 | 256 | 285 | 274 |
| CA | 271 | 531 | 650 | 703 | 692 | 714 |
| Sum of averages | 3,952 | 3,601 | 3,974 | 4,466 | 4,524 | 4,180 |
My question is,if is there any other way to obtain the sume of the averages of each type of vehicles only one expression not adding one for each type of vehicle may be using DISTINCT or something like that.
Thanks
Accepted Solutions
- Mark as New
- Bookmark
- Subscribe
- Mute
- Subscribe to RSS Feed
- Permalink
- Report Inappropriate Content
- Mark as New
- Bookmark
- Subscribe
- Mute
- Subscribe to RSS Feed
- Permalink
- Report Inappropriate Content
Hi Alejandro,
you need to use Advanced Aggregation function AGGR() :
sum(
aggr(
avg(TPDA)
, VehicleType, Year
)
)
You can learn advanced QlikView techniques like AGGR and Set Analysis from my lecture at the Masters Summit from Qlik. Or, if you can't make it to one of our summits, you could read about it in my book QlikView Your Business.
cheers,
Oleg Troyansky
- Mark as New
- Bookmark
- Subscribe
- Mute
- Subscribe to RSS Feed
- Permalink
- Report Inappropriate Content
May be this
Sum(Aggr(Avg(TPDA), Year, Categoria))
- Mark as New
- Bookmark
- Subscribe
- Mute
- Subscribe to RSS Feed
- Permalink
- Report Inappropriate Content
Thanks it works, i only added the dimension Concesión between year and Categoría like this.-
Sum(Aggr(Avg(TPDA), Año,Concesión, Categoria))
Thanks also to Oleg Troyansky his answer was almost the same only with different order of dimensions.
I have another question is the same chart but using weighted average, I'll post it in a few minutes
Thank you both
- Mark as New
- Bookmark
- Subscribe
- Mute
- Subscribe to RSS Feed
- Permalink
- Report Inappropriate Content
Hello Sunny,
could you help me please,
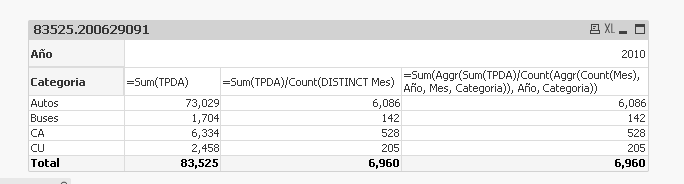
Some days ago you had helped me with the next function.- Sum(Aggr(Avg(TPDA), Año,Concesión, Categoria)), well, it gives me the right average but not in all of the years (2009,2010,2011), I guess this may be because of the dimensions but I'm not sure, the next is a table where the last two columns are the average using different functions, in the last column I'm using the function you've suggested me, and in the previous one I'm using another function where you can see for instance that in Autos, the sum of TPDA 73,029 divided between the number of months 12 is equal to 6,086, and the same for the other categories.
But the total of this previous column is the average of the averages, and I need the sum, any way I would like to use your formula but I can't get the same result.

I'm trying to attach the excel table in case you need to see the data but a can´t see the link.
Regards
- Mark as New
- Bookmark
- Subscribe
- Mute
- Subscribe to RSS Feed
- Permalink
- Report Inappropriate Content
Check here on how to upload a sample
- Mark as New
- Bookmark
- Subscribe
- Mute
- Subscribe to RSS Feed
- Permalink
- Report Inappropriate Content
Hello Sunny,
This is the excel file.
Regards
- Mark as New
- Bookmark
- Subscribe
- Mute
- Subscribe to RSS Feed
- Permalink
- Report Inappropriate Content
You can try this:
=Sum(TPDA)/Count(DISTINCT Mes)
or this
=Sum(Aggr(Sum(TPDA)/Count(Aggr(Count(Mes), Año, Mes, Categoria)), Año, Categoria))