Unlock a world of possibilities! Login now and discover the exclusive benefits awaiting you.
- Qlik Community
- :
- All Forums
- :
- QlikView App Dev
- :
- How to reduce data, but still see the "top" subtot...
- Subscribe to RSS Feed
- Mark Topic as New
- Mark Topic as Read
- Float this Topic for Current User
- Bookmark
- Subscribe
- Mute
- Printer Friendly Page
- Mark as New
- Bookmark
- Subscribe
- Mute
- Subscribe to RSS Feed
- Permalink
- Report Inappropriate Content
How to reduce data, but still see the "top" subtotals ?
I'ld like to have your opinion on a difficulty I'm facing.
Let's say I have the following data:
Data:
LOAD * INLINE [
Region, Country, City, Value
Europe, France, Paris, 100
Europe, France, Lyon, 80
Europe, UK, London, 110
America, USA, Washington, 120
America, USA, New-York, 150
America, Mexico, Mexico City, 50
];
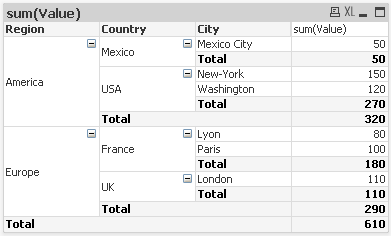
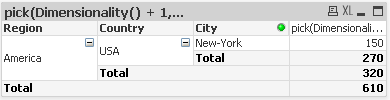
Now, I want that the user "New-York" can see only the data linked to field City "New-York" (like if I used a usual data reduce), but I want him to still see the sub totals of the higher dimensions:
If I use a basic section acces, the total would always be "150" for City / Country, Region, because there is only "New-York" left in the data.
And same thing with the user "USA" who can see all data linked to the Country "USA", and the aggregation of above dimensions.

I've found 2 ways to have the result I want, but they both are pain in the foot.
Solution 1:
Create a table that contains all data pre-aggregated for each level (sum by City, sum by Country, sum by City), and choose with data I want to display regarding the level I'm in.
FullData:
LOAD
'CITY' AS F.Level,
Region AS F.Region,
Country AS F.Country,
City AS F.City,
sum(Value) AS F.Value
RESIDENT Data
GROUP BY Region, Country, City;
CONCATENATE (FullData)
LOAD
'COUNTRY' AS F.Level,
Region AS F.Region,
Country AS F.Country,
sum(Value) AS F.Value
RESIDENT Data
GROUP BY Region, Country;
CONCATENATE (FullData)
LOAD
'REGION' AS F.Level,
Region AS F.Region,
sum(Value) AS F.Value
RESIDENT Data
GROUP BY Region;
CONCATENATE (FullData)
LOAD
'WORLD' AS F.Level,
sum(Value) AS F.Value
RESIDENT Data;
And in my charts, I use a huge expression that display something specific for the level I'm in (dimentionality), something like like:
pick(Dimensionality() + 1,
sum({$ <F.Level={'WORLD'}>} F.Value)
,
sum({$ <F.Level={'REGION'}>} if(Region = F.Region, F.Value))
/
count(Region)
,
sum({$ <F.Level={'COUNTRY'}>} if(Country = F.Country, F.Value))
/
count(Country)
,
sum({$ <F.Level={'CITY'}>} if(City = F.City, F.Value))
)
As you see, this is not easy to use, and the problem is that all expression are calculated even if only 1 is displayed.
Solution 2:
I don't make a data reduction on the City field, but on another "FilterCity" field (with no relation to the model), and I add filters on every chart and every listbox to display only allowed values.
pick(Dimensionality() + 1,
sum(total Value)
,
sum({$ <Region=P({$ <City*=P(FilterCity)>} Region)>} total <Region> Value)
,
sum({$ <Country=P({$ <City*=P(FilterCity)>} Country)>} total <Region, Country> Value)
,
sum({$ <City*=P(FilterCity)>} total <Region, Country, City> Value)
)
Once again, the expressions are huge, and the dimensions in listboxes have to bereplaced by a calculated expression.
=if(City = FilterCity, City)
If you have in mind another way of doing it, I'ld be glad!
- Mark as New
- Bookmark
- Subscribe
- Mute
- Subscribe to RSS Feed
- Permalink
- Report Inappropriate Content
If other users can see the totals and sub-totals then why dont you change all other city names into 'Other'
So in your above pivot table. It will be New York and Others.. 
Hope this is a possible solution for you!
Regards
MultiView
- Mark as New
- Bookmark
- Subscribe
- Mute
- Subscribe to RSS Feed
- Permalink
- Report Inappropriate Content
If I do so, the user that should see only:
- New-York
- sub total USA
- sub total America
- sub total World
will also see:
- sub total for every other country
- sub total for every other region
and it's not possible.
What do you mean by "change the other cities names"?