Unlock a world of possibilities! Login now and discover the exclusive benefits awaiting you.
- Qlik Community
- :
- All Forums
- :
- QlikView App Dev
- :
- Re: How to remove the duplicates in Pop up Lables?
- Subscribe to RSS Feed
- Mark Topic as New
- Mark Topic as Read
- Float this Topic for Current User
- Bookmark
- Subscribe
- Mute
- Printer Friendly Page
- Mark as New
- Bookmark
- Subscribe
- Mute
- Subscribe to RSS Feed
- Permalink
- Report Inappropriate Content
How to remove the duplicates in Pop up Lables?
Hello,
I have a scattered chart as shown below;
Project Number, Project Name, Region, Country as dimensions
GPM as sold, GPM as Forecasted, and a reference line as expressions
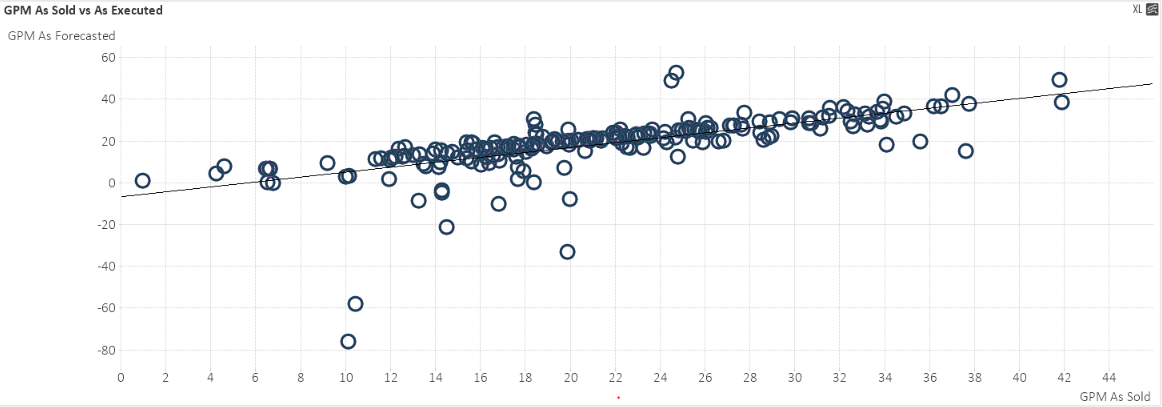
When I hover over the Bubble all my labels are duplicating as shown below;
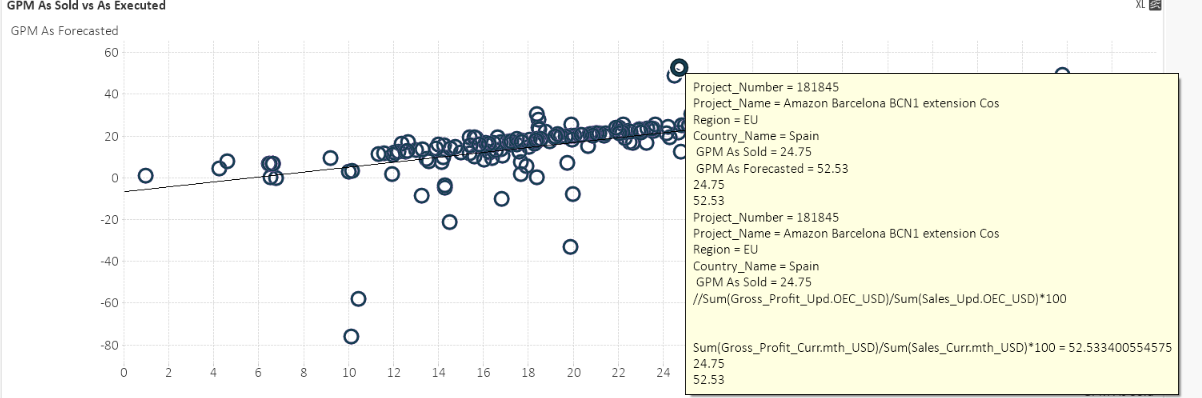
Please help me to remove all the duplicates here, thanks
(PS: I want to see only Project Number, Project Name, Region, Country, GPM as Sold, GPM as Forecasted)
Accepted Solutions
- Mark as New
- Bookmark
- Subscribe
- Mute
- Subscribe to RSS Feed
- Permalink
- Report Inappropriate Content
Instead of Using the third expression for the reference line axis, I have checked the Linear in the Trendlines to remove the extra duplicates as shown in the image below;
.png)
- Mark as New
- Bookmark
- Subscribe
- Mute
- Subscribe to RSS Feed
- Permalink
- Report Inappropriate Content
Instead of Using the third expression for the reference line axis, I have checked the Linear in the Trendlines to remove the extra duplicates as shown in the image below;