Unlock a world of possibilities! Login now and discover the exclusive benefits awaiting you.
- Qlik Community
- :
- All Forums
- :
- QlikView App Dev
- :
- Re: How to restrict the lenght of Line chart
- Subscribe to RSS Feed
- Mark Topic as New
- Mark Topic as Read
- Float this Topic for Current User
- Bookmark
- Subscribe
- Mute
- Printer Friendly Page
- Mark as New
- Bookmark
- Subscribe
- Mute
- Subscribe to RSS Feed
- Permalink
- Report Inappropriate Content
How to restrict the lenght of Line chart
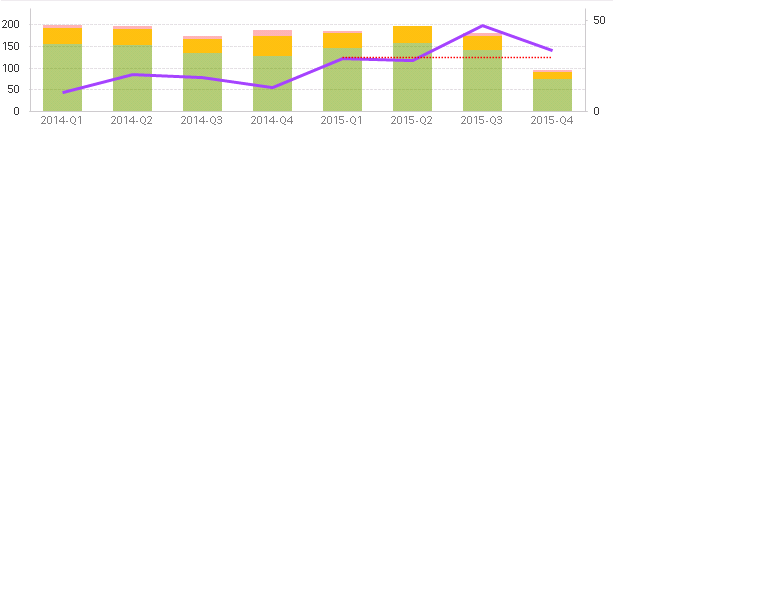
In below graph,Red dotted line showing target for 2015.It is not reference line,because I want to show target only for current year and if we include that expression in reference line calculation then it is showing horizontal line against all the quarter.Now issue is wheneve I select any value in below graph then that target line showing as a single dot for selected quarter only but instead of a single dot I want to show that a signle line.for.eg.If I select "2015-Q3" then according to selection that length of the line will show for 2015-Q1,2015-Q2,2015-Q3.but currently It is showing single dot for 2015-Q3.
Below expression I used for calculate the red dotted line
If(Years=vYearMax,(Count(Total{<Year={$(=Max(Year)-1},Quarter=>}REF_ID)/6)-0.8,Null()).Please suggest the solution for the same
- Mark as New
- Bookmark
- Subscribe
- Mute
- Subscribe to RSS Feed
- Permalink
- Report Inappropriate Content
Please post a small qlikview document that illustrates the problem.
talk is cheap, supply exceeds demand
- Mark as New
- Bookmark
- Subscribe
- Mute
- Subscribe to RSS Feed
- Permalink
- Report Inappropriate Content
What is your chart dimension? Quarter? Or maybe Year-Quarter?
Then try
If(Years=vYearMax,(Count(Total{<Year={$(=Max(Year)-1},Quarter=, [Year-Quarter]=>}REF_ID)/6)-0.8,Null())
- Mark as New
- Bookmark
- Subscribe
- Mute
- Subscribe to RSS Feed
- Permalink
- Report Inappropriate Content
Thanks for your reply
I already tried with that but it's not worked 
Please let me know if there ia any other option
- Mark as New
- Bookmark
- Subscribe
- Mute
- Subscribe to RSS Feed
- Permalink
- Report Inappropriate Content
I think if you want to have your chart to ignore selections on the dimension (or to ignore it to some extent), you would need to use set analysis.
If above idea doesn't work (well, the exact expression can't work, since there are probably more than errors in that expression), we would need to better understand your setting, i.e. data model and chart set-up.
The easiest way to provide all necessary details is by posting a small sample QVW, and a description of the expected result (e.g. a sketched drawing or excel file).