Unlock a world of possibilities! Login now and discover the exclusive benefits awaiting you.
- Qlik Community
- :
- All Forums
- :
- QlikView App Dev
- :
- Re: How to scale all expressions into 1 to 10 scal...
- Subscribe to RSS Feed
- Mark Topic as New
- Mark Topic as Read
- Float this Topic for Current User
- Bookmark
- Subscribe
- Mute
- Printer Friendly Page
- Mark as New
- Bookmark
- Subscribe
- Mute
- Subscribe to RSS Feed
- Permalink
- Report Inappropriate Content
How to scale all expressions into 1 to 10 scale on Y - axis
Hi All ,
I have this bit different requirement from my client :
I am calculating monthwise Sales , Qty , Avg bill Value , Avg product per bill and showing it as a line chart separately .
Now client's requirement is to see all in one chart and that to on scale of 1 to 10 .
In simple way minimum of all expressions (i.e. sales , Qty , Avg bill value, Avg products per bill) has to be considered 1 , while maximum of all expressions has to be considered 10 . Now all values of all expressions lies between 1 to 10 & then it needs to show case as a line chart .
Looking for help here ASAP .
Thanks
- « Previous Replies
-
- 1
- 2
- Next Replies »
- Mark as New
- Bookmark
- Subscribe
- Mute
- Subscribe to RSS Feed
- Permalink
- Report Inappropriate Content
To get the above add Month as a dimension and change variables to add Month in the aggr function..
- Mark as New
- Bookmark
- Subscribe
- Mute
- Subscribe to RSS Feed
- Permalink
- Report Inappropriate Content
Hi Bhushan,
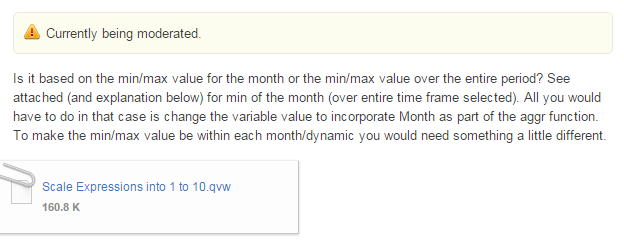
I've made some final modifications to the concept I've been describing (attached).
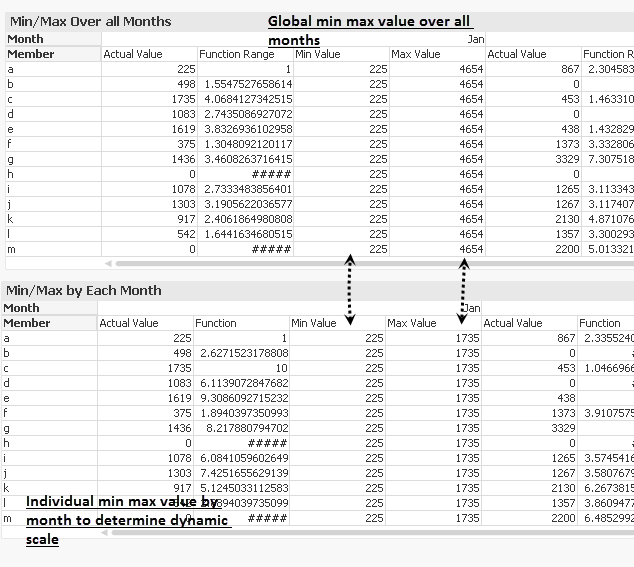
There is a chart that calculates the min/max value over the entire timeframe selected.
And there is another chart that calculates the min/max value for each month to determine the scale.
Let me know if this helps.
Thanks,
Camile
- Mark as New
- Bookmark
- Subscribe
- Mute
- Subscribe to RSS Feed
- Permalink
- Report Inappropriate Content
Hi Camile ,
I am just working on the suggestion provided by you .
For me there is no Customers , as all my calculations are no monthly . So i m just remving customers from your equation.
My final outcome is line chart of all my expressions within 1 to 10 for last 15 months ....
I m still struggling in getting functional value by teh logic u given * i.e. max & min ).. so debugging the same .
- Mark as New
- Bookmark
- Subscribe
- Mute
- Subscribe to RSS Feed
- Permalink
- Report Inappropriate Content
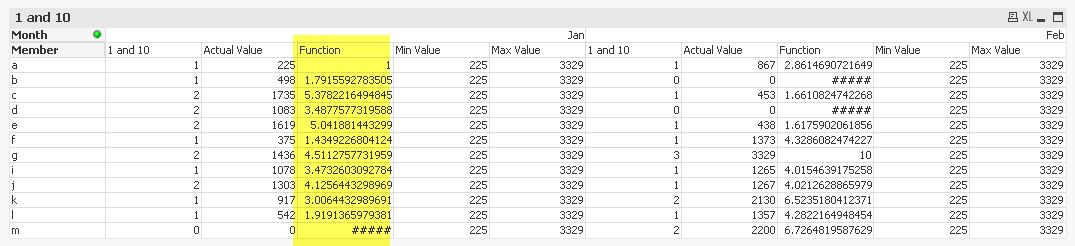
So from the example above you should just be able to switch Member with Month for the variable values....
Just use the first attachment I put together (only by Member) and switch the variable from Member to Month (and switch the dimension from Member to Month as well).
- Mark as New
- Bookmark
- Subscribe
- Mute
- Subscribe to RSS Feed
- Permalink
- Report Inappropriate Content
Hi Bhushan,
I'm glad it was able to work.
I'm not sure if you can change it or not -- but can you instead mark the answer with the attachment as correct as I think it will be more useful for people trying to find/use a working example.
Thanks,
Camile
- Mark as New
- Bookmark
- Subscribe
- Mute
- Subscribe to RSS Feed
- Permalink
- Report Inappropriate Content
Thanks a zillion Camile J ,
It works for me .... !!!!!
really appreciating power of Community ..
- « Previous Replies
-
- 1
- 2
- Next Replies »